Marked Zone
The Marked Zone annotation defines a closed figure plotted on the view-port. Its boundaries are set according to properties defining values along two axes of the series. There are two marked zone annotation: CartesianMarkedZoneAnnotation and PolarMarkedZoneAnnotation.
Common properties to the two types of annotations include:
BackColor: Sets the back color of the annotation.
BorderDashStyle: Defines the dash style of the border of the annotation.
BorderDashPattern: Defines the dash pattern of the border of the annotation.
BorderColor: Sets the color of the border of the annotation.
BorderWidth: Specifies the width of the border of the annotation.
Cartesian Marked Zone Annotation
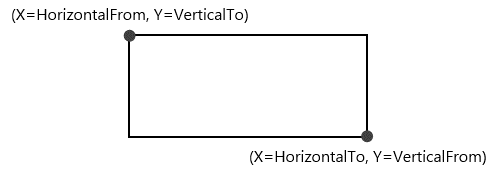
The CartesianMarkedzoneAnnotation is a rectangle defined by the HorizontalFrom/To and VerticalFrom/To properties.
Figure 1: Marked Annotation
Properties
Besides the HorizontalFrom/To and VerticalFrom/To properties that are used for defining the rectangle, the CartesianMarkedzoneAnnotation exposes the following properties:
HorizontalAxis and VerticalAxis: Used for associating the annotation with the chart axes.
BackColorL: Defines the back color of the marked zone.
BorderColorL Specifies the border color of the marked zone.
BorderWidth: Sets the border width of the marked zone.
Examples
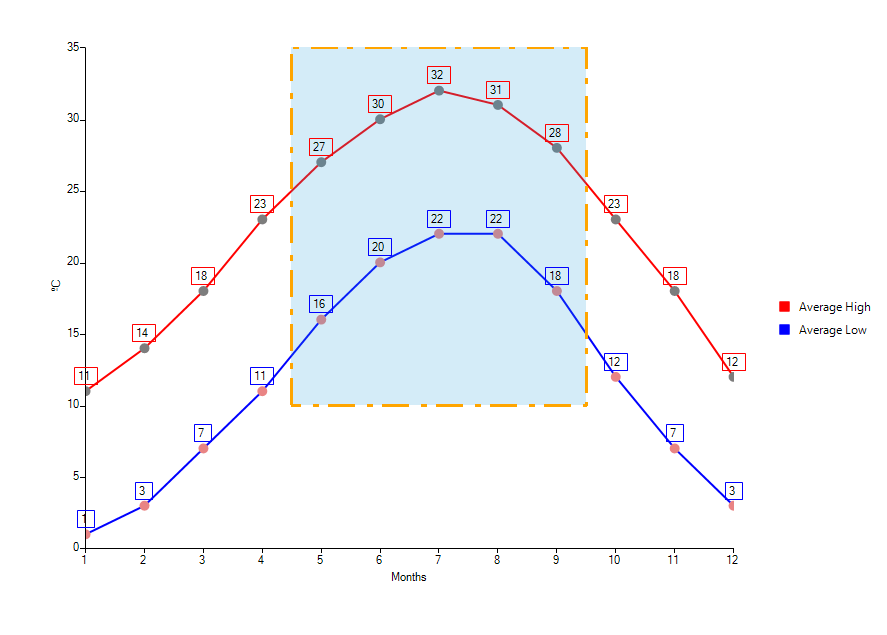
In the following example additional styling is applied to the default look of the annotation.
Figure 2: Annotation With All Bounds Set
Define Annotation
CartesianMarkedZoneAnnotation annotation = new CartesianMarkedZoneAnnotation();
annotation.HorizontalFrom = 4;
annotation.HorizontalTo = 9;
annotation.VerticalFrom = 10;
annotation.VerticalTo = 35;
annotation.BackColor = Color.FromArgb(50, 37, 160, 219);
annotation.BorderDashStyle = DashStyle.Custom;
annotation.BorderDashPattern = new float[] { 9, 3, 2, 4 };
annotation.BorderColor = Color.Orange;
annotation.BorderWidth = 3;
this.radChartView1.Annotations.Add(annotation);
Dim annotation As New CartesianMarkedZoneAnnotation()
annotation.HorizontalFrom = 4
annotation.HorizontalTo = 9
annotation.VerticalFrom = 10
annotation.VerticalTo = 35
annotation.BackColor = Color.FromArgb(50, 37, 160, 219)
annotation.BorderDashStyle = DashStyle.[Custom]
annotation.BorderDashPattern = New Single() {9, 3, 2, 4}
annotation.BorderColor = Color.Orange
annotation.BorderWidth = 3
Me.radChartView1.Annotations.Add(annotation)
The flexible design of the marked zone annotation allows the user to omit one (or more) of the four HorizontalFrom/To and VerticalFrom/To properties. The following table details the relationship between the specified properties and the occupied interval on the axis:
| Specified Properties | Occupied interval |
|---|---|
| Both From and To | [Min(From,To), Max(From,To)] |
| Only From | [From,+∞] |
| Only To | [-∞, To] |
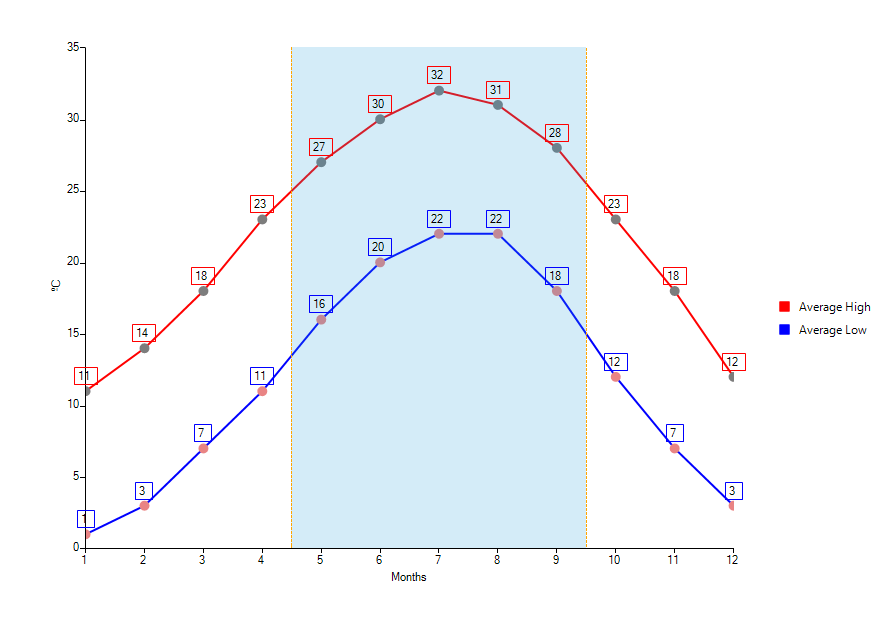
Here is the previous example with some of the settings commented
Horizontally Defined Marked Zone
CartesianMarkedZoneAnnotation annotation = new CartesianMarkedZoneAnnotation();
annotation.HorizontalFrom = 4;
annotation.HorizontalTo = 9;
//annotation.VerticalFrom = 10;
//annotation.VerticalTo = 35;
annotation.BackColor = Color.FromArgb(50, 37, 160, 219);
//annotation.BorderDashStyle = DashStyle.Custom;
//annotation.BorderDashPattern = new float[] { 9, 3, 2, 4 };
annotation.BorderColor = Color.Orange;
annotation.BorderWidth = 1;
this.radChartView1.Annotations.Add(annotation);
Dim annotation As New CartesianMarkedZoneAnnotation()
annotation.HorizontalFrom = 4
annotation.HorizontalTo = 9
'annotation.VerticalFrom = 10;
'annotation.VerticalTo = 35;
annotation.BackColor = Color.FromArgb(50, 37, 160, 219)
'annotation.BorderDashStyle = DashStyle.Custom;
'annotation.BorderDashPattern = new float[] { 9, 3, 2, 4 };
annotation.BorderColor = Color.Orange
annotation.BorderWidth = 1
Me.radChartView1.Annotations.Add(annotation)
Figure 3: Horizontally Defined Marked Zone
Polar Marked Zone Annotation
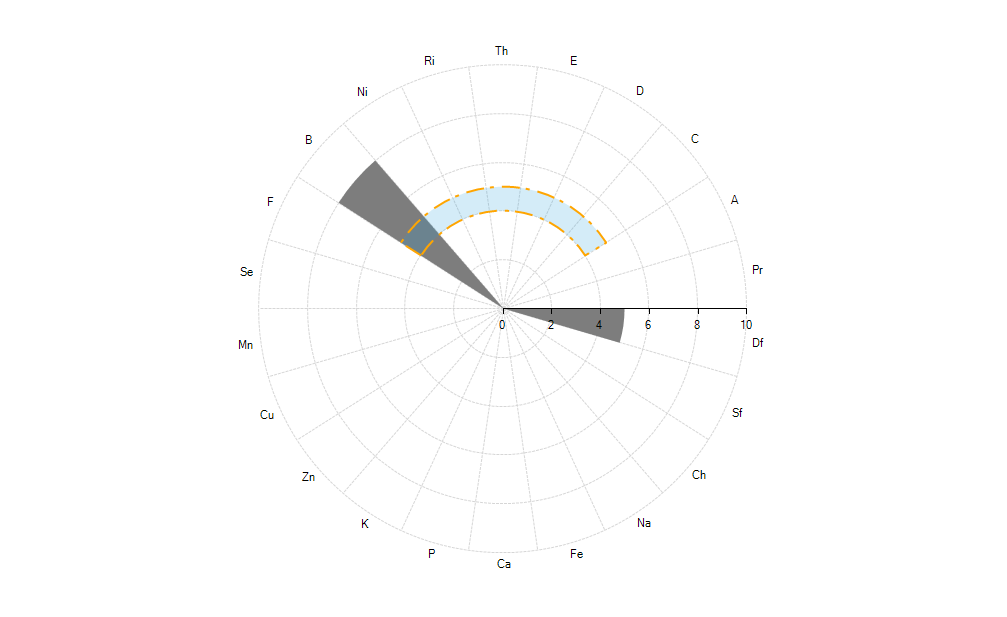
The PolarMarkedZoneAnnotation defines a pie arc segment painted on a Polar area. This annotation is compatible for series using a Polar coordinate system: RadarColumnSeries, RadarPointSeries, and PolarPointSeries.
Figure 4: Polar Marked Zone Annotation in Combination with a RadarColumnSeries
Properties
Four properties need to be set for a polar marked zone annotation.
PolarFrom: Gets or sets the starting point on the Polar axis.
PolarTo: Gets or sets the ending point on the Polar axis.
RadialFrom: Gets or sets the starting point on the Radial axis.
RadialTo: Gets or sets the ending point on the Radial axis.
The values set to the RadialFrom and RadialTo properties need to correspond to the type of the series. In the case of Radar series, one needs to use categories as values and in the case of a Polar series one needs to use angles.
Example
The example below adds a PolarMarkedZoneAnnotation to a PolarPointSeries.
Figure 5: PolarPointSeries and Markzed Zone
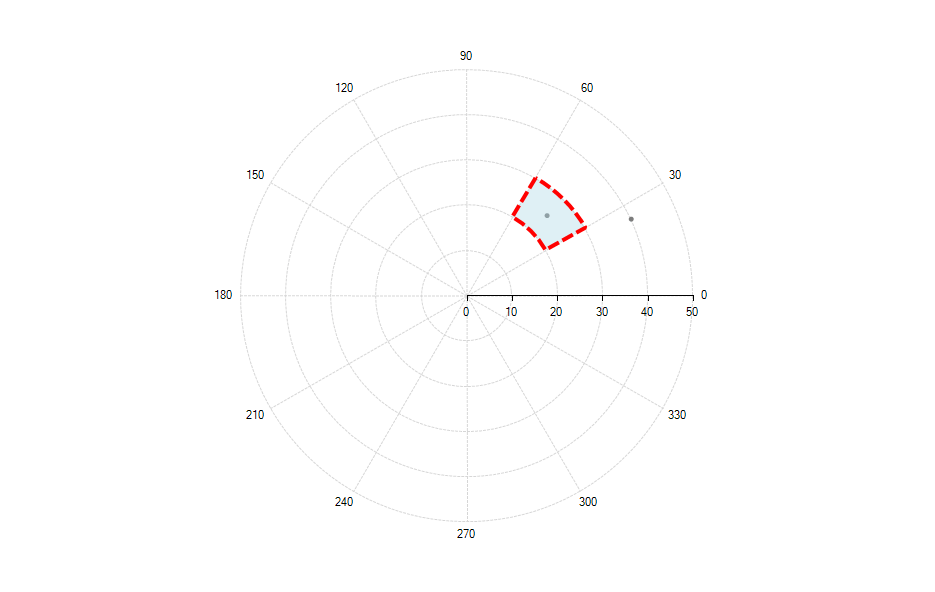
Polar Marked Zone Settings
this.radChartView1.AreaType = ChartAreaType.Polar;
PolarPointSeries polarPointSeries = new PolarPointSeries();
PolarDataPoint dataPoint = new PolarDataPoint();
dataPoint.Value = 40;
dataPoint.Angle = 25;
polarPointSeries.DataPoints.Add(dataPoint);
dataPoint = new PolarDataPoint();
dataPoint.Value = 25;
dataPoint.Angle = 45;
polarPointSeries.DataPoints.Add(dataPoint);
this.radChartView1.AreaType = ChartAreaType.Polar;
this.radChartView1.Series.Add(polarPointSeries);
PolarMarkedZoneAnnotation annotation = new PolarMarkedZoneAnnotation();
annotation.BorderWidth = 4;
annotation.BackColor = Color.FromArgb(100, Color.LightBlue);
annotation.BorderColor = Color.Red;
annotation.PolarFrom = 20;
annotation.PolarTo = 30;
annotation.RadialFrom = 30;
annotation.RadialTo = 60;
this.radChartView1.Annotations.Add(annotation);
Me.radChartView1.AreaType = ChartAreaType.Polar
Dim polarPointSeries As PolarPointSeries = New PolarPointSeries()
Dim dataPoint As PolarDataPoint = New PolarDataPoint()
dataPoint.Value = 40
dataPoint.Angle = 25
polarPointSeries.DataPoints.Add(dataPoint)
dataPoint = New PolarDataPoint()
dataPoint.Value = 25
dataPoint.Angle = 45
polarPointSeries.DataPoints.Add(dataPoint)
Me.radChartView1.AreaType = ChartAreaType.Polar
Me.radChartView1.Series.Add(polarPointSeries)
Dim annotation As PolarMarkedZoneAnnotation = New PolarMarkedZoneAnnotation()
annotation.BorderWidth = 4
annotation.BackColor = Color.FromArgb(100, Color.LightBlue)
annotation.BorderColor = Color.Red
annotation.PolarFrom = 20
annotation.PolarTo = 30
annotation.RadialFrom = 30
annotation.RadialTo = 60
Me.radChartView1.Annotations.Add(annotation)