Custom rendering
Typically, data points are rendered with different colors in order to indicate that they belong to different logical groups, i.e. series. Thus, if you intend to plot data of single series, all data points will be styled in the same manner. In certain cases, however, you may want customize the appearance of each data point in the series depending on its value in order to provide additional information about the plotted data. For example, values that fall into a critical range may be rendered in bright colors, so that they can be distinguished more easily. If you use BarSeries to visualize the data, it will be quite easy to achieve the desired outcome, since each bar is rendered individually, based on its BackColor and BorderColor properties. This is not the case, however, if you need to use LineSeries. This kind of series draws one line on a single pass which makes binding its values to predefined colors is a bit more complex task. The current article serves as a step-by-step tutorial on how to implement this scenario.
For the purpose of the article, let us make the following assumptions:
LineSeries should be used to plot the temperature data for a given region for one month.
The values of all 30 categorical data points fall in the range of 0 to 30 degrees.
-
Whenever the line of the series reaches certain value its color should change using the following scheme:
10 degrees C - green
15 degrees C - orange
20 degrees C - red
25 degrees C - dark red
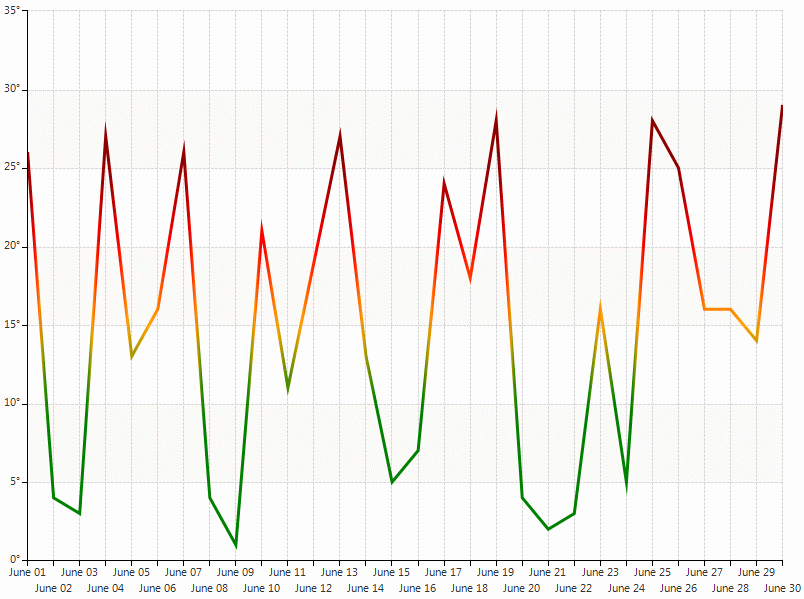
The following image illustrates the desired outcome:
Figure 1: Custom Rendering

The starting point of the article is a form with one RadChartView on it. In the form’s Load event handler create a LineSeries instance and add categorical data points. The current example generates random values that fall in the range of 0 – 30. After adding the series to the RadChartView.Series collection, set the LabelFormat and LabelFitMode of the HorizontalAxis and VerticalAxis properties of the series to appropriate values. Further, subscribe to the CreateRenderer of the chart and instantiate the Renderer property of the event arguments to a new CustomCartesianRederer instance. The CreateRenderer event allows you to plug any custom implementation of chart renderer. Here is how your snippet should look like:
Add Points and Create A Custom Renderer
public partial class CustomRenderer : Form
{
    public CustomRenderer()
    {
        InitializeComponent();
        this.radChartView1.CreateRenderer += new ChartViewCreateRendererEventHandler(radChartView1_CreateRenderer);
    }
    protected override void OnLoad(EventArgs e)
    {
        base.OnLoad(e);
        LineSeries series = new LineSeries();
        Random rnd = new Random();
        for (int i = 0; i < 30; i++)
        {
            series.DataPoints.Add(new CategoricalDataPoint(rnd.Next(0, 30), DateTime.Now.AddDays(i)));
        }
        this.radChartView1.Series.Add(series);
        series.VerticalAxis.LabelFormat = "{0}°";
        series.HorizontalAxis.LabelFormat = "{0:M}";
        series.HorizontalAxis.LabelFitMode = AxisLabelFitMode.MultiLine;
        this.radChartView1.ShowGrid = true;
    }
    void radChartView1_CreateRenderer(object sender, ChartViewCreateRendererEventArgs e)
    {
        e.Renderer = new CustomCartesianRenderer(e.Area as CartesianArea);
    }
}
Public Class CustomRenderer
    Protected Overrides Sub OnLoad(e As System.EventArgs)
        MyBase.OnLoad(e)
        AddHandler RadChartView1.CreateRenderer, AddressOf RadChartView1_CreateRenderer
        Dim series As New LineSeries()
        Dim rnd As New Random()
        For i = 0 To 30
            series.DataPoints.Add(New CategoricalDataPoint(rnd.Next(0, 40), DateTime.Now.AddDays(i)))
        Next
        Me.RadChartView1.Series.Add(series)
        series.VerticalAxis.LabelFormat = "{0}°"
        series.HorizontalAxis.LabelFormat = "{0:M}"
        series.HorizontalAxis.LabelFitMode = AxisLabelFitMode.MultiLine
        Me.RadChartView1.ShowGrid = True
    End Sub
    Private Sub RadChartView1_CreateRenderer(sender As System.Object, e As Telerik.WinControls.UI.ChartViewCreateRendererEventArgs)
        e.Renderer = New CustomCartesianRenderer(DirectCast(e.Area, CartesianArea))
    End Sub
End Class
Now you need to create a CustomCartesianRenderer class that inherits CartesianRenderer and overrides the Initialize method. This method creates and arranges draw parts responsible for the rendering of each RadChartView segment. After calling the base method, the DrawParts collection contains objects that know how to draw axes, labels, series etc. The particular draw part you would like to replace is of type LineSeriesDrawPart. Your code should be like the following:
Custom Renderer Class
public class CustomCartesianRenderer : CartesianRenderer
{
    public CustomCartesianRenderer(CartesianArea area)
        : base(area)
    { }
    protected override void Initialize()
    {
        base.Initialize();
        for (int i = 0; i < this.DrawParts.Count; i++)
        {
            LineSeriesDrawPart linePart = this.DrawParts[i] as LineSeriesDrawPart;
            if (linePart != null)
            {
                this.DrawParts[i] = new CustomLineSeriesDrawPart((LineSeries)linePart.Element, this);
            }
        }
    }
}
Public Class CustomCartesianRenderer
    Inherits CartesianRenderer
    Public Sub New(area As CartesianArea)
        MyBase.New(area)
    End Sub
    Protected Overrides Sub Initialize()
        MyBase.Initialize()
        For i As Integer = 0 To Me.DrawParts.Count - 1
            Dim linePart As LineSeriesDrawPart = TryCast(Me.DrawParts(i), LineSeriesDrawPart)
            If linePart IsNot Nothing Then
                Me.DrawParts(i) = New CustomLineSeriesDrawPart(DirectCast(linePart.Element, LineSeries), Me)
            End If
        Next
    End Sub
End Class
Let us further focus on the CustomLineSeriesDrawPart implementation. To introduce custom rendering of the line you need to override the DrawLine method and use the GraphicsPath object provided by the GetLinePath method. In order to draw a path with gradient colors, you need to use a LinearGradientBrush and use its ColorBlend to set appropriate positions and colors. So, before we get to the CustomLineSeriesDrawPart class, let us create a class that will let us easily store Color-Position couples:
Color Storage
public class ColorPositionBlend
{
    private List<float> positions;
    private List<Color> colors;
    public ColorPositionBlend()
    {
        positions = new List<float>();
        colors = new List<Color>();
    }
    public void Add(Color color, float position)
    {
        this.colors.Add(color);
        this.positions.Add(position);
    }
    public void Add(ColorPositionBlend colorPositionBlend)
    {
        this.positions.AddRange(colorPositionBlend.positions);
        this.colors.AddRange(colorPositionBlend.colors);
    }
    public float[] Positions
    {
        get { return this.positions.ToArray(); }
    }
    public Color[] Colors
    {
        get { return this.colors.ToArray(); }
    }
}
Public Class ColorPositionBlend
    Private m_positions As List(Of Single)
    Private m_colors As List(Of Color)
    Public Sub New()
        m_positions = New List(Of Single)()
        m_colors = New List(Of Color)()
    End Sub
    Public Sub Add(color As Color, position As Single)
        Me.m_colors.Add(color)
        Me.m_positions.Add(position)
    End Sub
    Public Sub Add(colorPositionBlend As ColorPositionBlend)
        Me.m_positions.AddRange(colorPositionBlend.Positions)
        Me.m_colors.AddRange(colorPositionBlend.Colors)
    End Sub
    Public ReadOnly Property Positions() As Single()
        Get
            Return Me.m_positions.ToArray()
        End Get
    End Property
    Public ReadOnly Property Colors() As Color()
        Get
            Return Me.m_colors.ToArray()
        End Get
    End Property
End Class
Getting back to the CustomLineSeriesDrawPart, you need to create a method which calculates the positions and colors that need to be assigned to the ColorBlend of the brush. Additionally, you have to calculate the color of the points that fall between two predefined values, e.g. if the input value is 16, the color should be one fifth orange and four fifths red. Further, you have to make sure that the line segments between each two consecutive points are colored properly, regardless of points’ values. For example, if a point with value 0 is followed by a point with value 30, you need to ensure that the line that connects them does not go from green to dark red directly, but contains also orange and red when it crosses 15 and 20, respectively. Here is one possible implementation of the above scenario:
DrawLine Method Implementation
public class CustomLineSeriesDrawPart : LineSeriesDrawPart
{
    float[] predefinedValues = new float[] { 10, 15, 20, 25 };
    Color[] predefinedColors = new Color[] { Color.Green, Color.Orange, Color.Red, Color.DarkRed };

    public CustomLineSeriesDrawPart(LineSeriesBase series, IChartRenderer renderer)
        : base(series, renderer)
    { }
    protected override void DrawLine()
    {
        LineSeries series = this.Element as LineSeries;
        if (series.DataPoints.Count < 2)
        {
            return;
        }
        RectangleF rect = this.Element.Bounds;
        rect.Offset(this.OffsetX, this.OffsetY);
        if (rect.IsEmpty)
        {
            return;
        }
        GraphicsPath path = GetLinePath();
        LinearGradientBrush linearBrush = new LinearGradientBrush(rect, Color.Transparent, Color.Transparent, 0f);
        ColorPositionBlend colorPositionBlend = GetColorPositionBlend(series.DataPoints);
        System.Drawing.Drawing2D.ColorBlend blend = new System.Drawing.Drawing2D.ColorBlend();
        blend.Positions = colorPositionBlend.Positions;
        blend.Colors = colorPositionBlend.Colors;
        linearBrush.InterpolationColors = blend;
        Graphics graphics = this.Renderer.Surface as Graphics;
        graphics.SmoothingMode = SmoothingMode.AntiAlias;
        graphics.DrawPath(new Pen(linearBrush, 3), path);
    }
    private ColorPositionBlend GetColorPositionBlend(ChartDataPointCollection dataPoints)
    {
        ColorPositionBlend blend = new ColorPositionBlend();
        decimal majorStep = 1m / (dataPoints.Count - 1);
        for (int i = 0; i < dataPoints.Count; i++)
        {
            float position = (float)(i * majorStep);
            Color color = GetValueColor((double)((CategoricalDataPoint)dataPoints[i]).Value);
            blend.Add(color, position);
            if (i < dataPoints.Count - 1)
            {
                double currentValue = (double)((CategoricalDataPoint)dataPoints[i]).Value;
                double nextValue = (double)((CategoricalDataPoint)dataPoints[i + 1]).Value;
                ColorPositionBlend additionalBlends = GetAdditionalColorPositionBlend(currentValue, nextValue, majorStep, i);
                blend.Add(additionalBlends);
            }
        }
        return blend;
    }
    private ColorPositionBlend GetAdditionalColorPositionBlend(double currentValue, double nextValue, decimal majorStep, int iteration)
    {
        ColorPositionBlend blend = new ColorPositionBlend();
        if (currentValue < nextValue)
        {
            for (int j = 0; j < predefinedValues.Length; j++)
            {
                float colorValue = predefinedValues[j];
                if (currentValue < colorValue && colorValue < nextValue)
                {
                    float additionalPosition = (float)(iteration * majorStep) + (float)((colorValue - currentValue) / (nextValue - currentValue)) * (float)(majorStep);
                    Color additionalColor = GetValueColor(colorValue);
                    blend.Add(additionalColor, additionalPosition);
                }
            }
        }
        if (currentValue > nextValue)
        {
            for (int j = predefinedValues.Length - 1; j >= 0; j--)
            {
                float colorValue = predefinedValues[j];
                if (currentValue > colorValue && colorValue > nextValue)
                {
                    float additionalPosition = (float)(iteration * majorStep) + (float)((currentValue - colorValue) / (currentValue - nextValue)) * (float)(majorStep);
                    Color additionalColor = GetValueColor(colorValue);
                    blend.Add(additionalColor, additionalPosition);
                }
            }
        }
        return blend;
    }
    private Color GetValueColor(double value)
    {
        if (value <= predefinedValues[0])
        {
            return predefinedColors[0];
        }
        if (value >= predefinedValues[predefinedValues.Length - 1])
        {
            return predefinedColors[predefinedValues.Length - 1];
        }
        for (int i = 0; i < predefinedValues.Length - 1; i++)
        {
            if (predefinedValues[i] <= value && value <= predefinedValues[i + 1])
            {
                double c = (predefinedValues[i + 1] - value) / (predefinedValues[i + 1] - predefinedValues[i]);
                return Color.FromArgb((int)(predefinedColors[i].R * c + predefinedColors[i + 1].R * (1 - c)),
                                      (int)(predefinedColors[i].G * c + predefinedColors[i + 1].G * (1 - c)),
                                      (int)(predefinedColors[i].B * c + predefinedColors[i + 1].B * (1 - c)));
            }
        }
        return Color.Transparent;
    }
}
Public Class CustomLineSeriesDrawPart
    Inherits LineSeriesDrawPart
    Public Sub New(series As LineSeriesBase, renderer As IChartRenderer)
        MyBase.New(series, renderer)
    End Sub
    Private predefinedValues As Integer() = New Integer() {5, 16, 25, 35}
    Private predefinedColors As Color() = New Color() {Color.Green, Color.Orange, Color.Red, Color.DarkRed}
    Protected Overrides Sub DrawLine()
        Dim series As LineSeries = TryCast(Me.Element, LineSeries)
        If series.DataPoints.Count < 2 Then
            Return
        End If
        Dim rect As RectangleF = Me.Element.Bounds
        rect.Offset(Me.OffsetX, Me.OffsetY)
        If rect.IsEmpty Then
            Return
        End If
        Dim path As GraphicsPath = GetLinePath()
        Dim linearBrush As New LinearGradientBrush(rect, Color.Transparent, Color.Transparent, 0.0F)
        Dim colorPositionBlend As ColorPositionBlend = GetColorPositionBlend(series.DataPoints)
        Dim blend As New System.Drawing.Drawing2D.ColorBlend()
        blend.Positions = colorPositionBlend.Positions
        blend.Colors = colorPositionBlend.Colors
        linearBrush.InterpolationColors = blend
        Dim graphics As Graphics = TryCast(Me.Renderer.Surface, Graphics)
        graphics.SmoothingMode = SmoothingMode.AntiAlias
        graphics.DrawPath(New Pen(linearBrush, 3), path)
    End Sub
    Private Function GetColorPositionBlend(dataPoints As ChartDataPointCollection) As ColorPositionBlend
        Dim blend As New ColorPositionBlend()
        Dim majorStep As Decimal = 1D / (dataPoints.Count - 1)
        For i As Integer = 0 To dataPoints.Count - 1
            Dim position As Single = CSng(i * majorStep)
            Dim color As Color = GetValueColor(CDbl(DirectCast(dataPoints(i), Telerik.Charting.CategoricalDataPoint).Value))
            blend.Add(color, position)
            If i < dataPoints.Count - 1 Then
                Dim currentValue As Double = CDbl(DirectCast(dataPoints(i), Telerik.Charting.CategoricalDataPoint).Value)
                Dim nextValue As Double = CDbl(DirectCast(dataPoints(i + 1), Telerik.Charting.CategoricalDataPoint).Value)
                Dim additionalBlends As ColorPositionBlend = GetAdditionalColorPositionBlend(currentValue, nextValue, majorStep, i)
                blend.Add(additionalBlends)
            End If
        Next
        Return blend
    End Function
    Private Function GetAdditionalColorPositionBlend(currentValue As Double, nextValue As Double, majorStep As Decimal, iteration As Integer) As ColorPositionBlend
        Dim blend As New ColorPositionBlend()
        If currentValue < nextValue Then
            For j As Integer = 0 To predefinedValues.Length - 1
                Dim colorValue As Single = predefinedValues(j)
                If currentValue < colorValue AndAlso colorValue < nextValue Then
                    Dim additionalPosition As Single = CSng(iteration * majorStep) + CSng((colorValue - currentValue) / (nextValue - currentValue)) * CSng(majorStep)
                    Dim additionalColor As Color = GetValueColor(colorValue)
                    blend.Add(additionalColor, additionalPosition)
                End If
            Next
        End If
        If currentValue > nextValue Then
            For j As Integer = predefinedValues.Length - 1 To 0 Step -1
                Dim colorValue As Single = predefinedValues(j)
                If currentValue > colorValue AndAlso colorValue > nextValue Then
                    Dim additionalPosition As Single = CSng(iteration * majorStep) + CSng((currentValue - colorValue) / (currentValue - nextValue)) * CSng(majorStep)
                    Dim additionalColor As Color = GetValueColor(colorValue)
                    blend.Add(additionalColor, additionalPosition)
                End If
            Next
        End If
        Return blend
    End Function
    Private Function GetValueColor(value As Double) As Color
        If value <= predefinedValues(0) Then
            Return predefinedColors(0)
        End If
        If value >= predefinedValues(predefinedValues.Length - 1) Then
            Return predefinedColors(predefinedValues.Length - 1)
        End If
        For i As Integer = 0 To predefinedValues.Length - 2
            If predefinedValues(i) <= value AndAlso value <= predefinedValues(i + 1) Then
                Dim c As Double = (predefinedValues(i + 1) - value) / (predefinedValues(i + 1) - predefinedValues(i))
                Return Color.FromArgb(CInt(predefinedColors(i).R * c + predefinedColors(i + 1).R * (1 - c)), CInt(predefinedColors(i).G * c + predefinedColors(i + 1).G * (1 - c)), CInt(predefinedColors(i).B * c + predefinedColors(i + 1).B * (1 - c)))
            End If
        Next
        Return Color.Transparent
    End Function
End Class
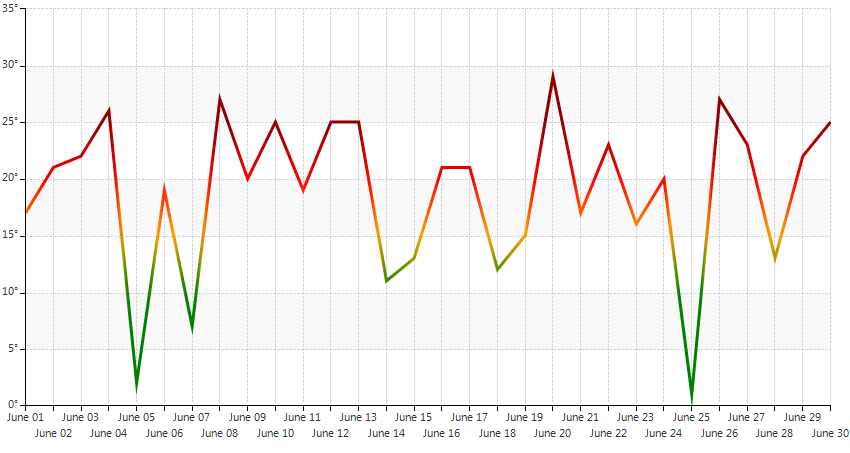
After you compile the project, you should get a result similar to the screenshot below:
Figure 2: Rendering Implementation Result
