Plot Band
Plot band annotation is a stripe, crossing its corresponding axis, specified by the From and To properties.
Common properties to the three types of annotations include:
BackColor: Sets the back color of the annotation.
BorderDashStyle: Defines the dash style of the border of the annotation.
BorderColor: Sets the color of the border of the annotation.
BorderWidth: Specifies the width of the border of the annotation.
Cartesian Plot Band Annotation
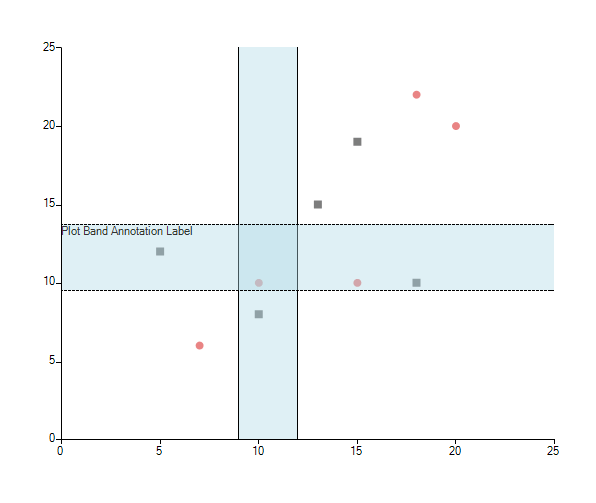
Cartesian plot band annotation is either a horizontal or a vertical stripe that crosses from start to end the vertical or the horizontal axis respectively.
Here is what CartesianPlotBandAnnotation looks like:
Figure 1: CartesianPlotBandAnnotation
Plot Band Annotation Setup
CartesianPlotBandAnnotation annotation1 = new CartesianPlotBandAnnotation();
annotation1.Axis = this.radChartView1.Axes[0] as CartesianAxis;
annotation1.From = 0.5;
annotation1.To = 1.5;
annotation1.BackColor = Color.FromArgb(100, Color.LightBlue);
annotation1.BorderColor = Color.Black;
annotation1.BorderWidth = 1;
this.radChartView1.Annotations.Add(annotation1);
CartesianPlotBandAnnotation annotation2 = new CartesianPlotBandAnnotation();
annotation2.Axis = this.radChartView1.Axes[1] as CartesianAxis;
annotation2.From = 4.5;
annotation2.To = 5.5;
annotation2.BackColor = Color.FromArgb(100, Color.LightBlue);
annotation2.BorderColor = Color.Black;
annotation2.BorderWidth = 1;
this.radChartView1.Annotations.Add(annotation2);
Dim annotation1 As New CartesianPlotBandAnnotation()
annotation1.Axis = TryCast(Me.radChartView1.Axes(0), CartesianAxis)
annotation1.From = 0.5
annotation1.[To] = 1.5
annotation1.BackColor = Color.FromArgb(100, Color.LightBlue)
annotation1.BorderColor = Color.Black
annotation1.BorderWidth = 1
Me.radChartView1.Annotations.Add(annotation1)
Dim annotation2 As New CartesianPlotBandAnnotation()
annotation2.Axis = TryCast(Me.radChartView1.Axes(1), CartesianAxis)
annotation2.From = 4.5
annotation2.[To] = 5.5
annotation2.BackColor = Color.FromArgb(100, Color.LightBlue)
annotation2.BorderColor = Color.Black
annotation2.BorderWidth = 1
Me.radChartView1.Annotations.Add(annotation2)
Properties:
Axis: The Cartesian plotBand annotation needs to be associated with horizontal or vertical axis explicitly.
From (of type object): The starting point for the plot band. When the associated axis is numerical (Linear or Logarithmic) a numeric value is expected and when it is a CategoricalAxis - a category.
To (of type object): The ending point for the plot band. When the associated axis is numerical (Linear or Logarithmic) a numeric value is expected and when it is a CategoricalAxis - a category.
Label: This property allows you to display text near the annotation and indicate what it is for.
Polar Axis Plot Band Annotation
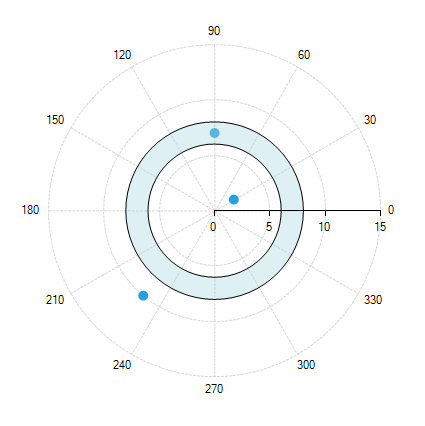
The Polar axis plot band annotation resembles a donut.
Here is what PolarAxisPlotBandAnnotation looks like:
Figure 2: PolarAxisPlotBandAnnotation
Polar Axis Annotation
PolarAxisPlotBandAnnotation annotation1 = new PolarAxisPlotBandAnnotation();
annotation1.From = 6;
annotation1.To = 8;
annotation1.BackColor = Color.FromArgb(100, Color.LightBlue);
annotation1.BorderColor = Color.Black;
annotation1.BorderWidth = 1;
annotation1.BorderDashStyle = DashStyle.Solid;
this.radChartView1.Annotations.Add(annotation1);
Dim annotation1 As New PolarAxisPlotBandAnnotation()
annotation1.From = 6
annotation1.[To] = 8
annotation1.BackColor = Color.FromArgb(100, Color.LightBlue)
annotation1.BorderColor = Color.Black
annotation1.BorderWidth = 1
annotation1.BorderDashStyle = DashStyle.Solid
Me.radChartView1.Annotations.Add(annotation1)
Properties:
From (of type double): The starting point for the plot band.
To (of type double): The ending point for the plot band.
Radial Axis Plot Band Annotation
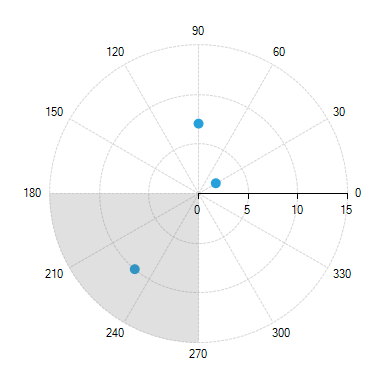
Radial axis plot band annotations represent visually a sector of the circle (pie slice).
A plot band starting from 180 degrees and ending in 270 degrees will look like this:
Figure 3: RadialAxisPlotBandAnnotation
Radial Axis Annotations
RadialAxisPlotBandAnnotation annotation1 = new RadialAxisPlotBandAnnotation();
annotation1.From = 180;
annotation1.To = 270;
this.radChartView1.Annotations.Add(annotation1);
Dim annotation1 As New RadialAxisPlotBandAnnotation()
annotation1.From = 180
annotation1.[To] = 270
Me.radChartView1.Annotations.Add(annotation1)
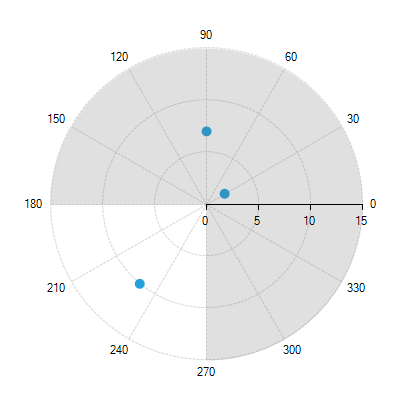
If you wonder how to annotate the bigger segment from the image above, then you should use the From and To values.
Figure 3: Annotated Bigger Segment
Define Bigger Segment
RadialAxisPlotBandAnnotation annotation1 = new RadialAxisPlotBandAnnotation();
annotation1.From = 270;
annotation1.To = 180;
this.radChartView1.Annotations.Add(annotation1);
Dim annotation1 As New RadialAxisPlotBandAnnotation()
annotation1.From = 270
annotation1.[To] = 180
Me.radChartView1.Annotations.Add(annotation1)
Properties:
From (of type object): The starting point for the plot band. When the Radial axis is NumericRadialAxis a numeric value is expected and when it is a CategoricalRadialAxis - a category.
To (of type object): Tthe ending point for the plot band. When the Radial axis is NumericRadialAxis a numeric value is expected and when it is a CategoricalRadialAxis - a category.