Server-side Programming Overview
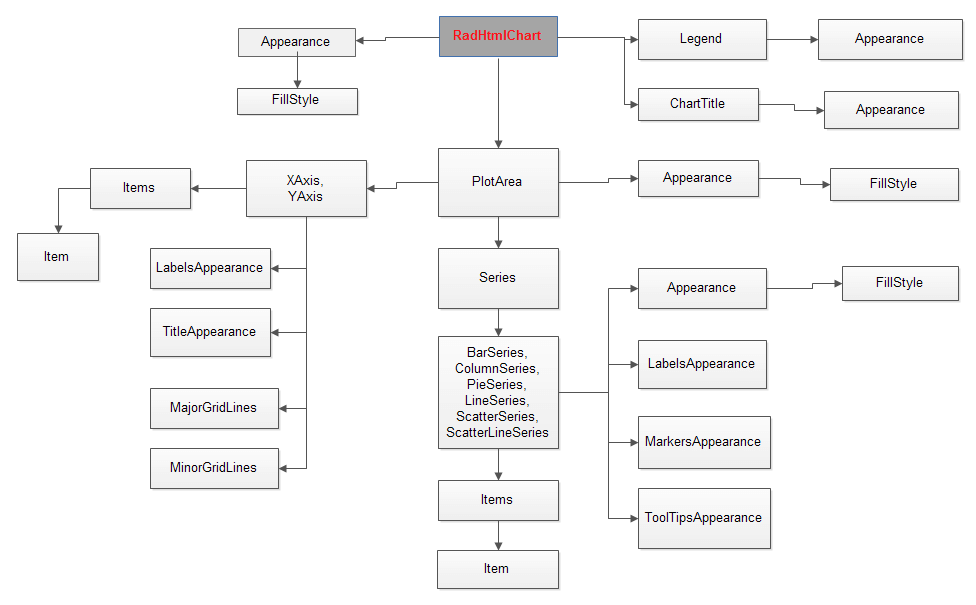
The ASP NET AJAX Chart offers many properties to allow detailed customizations.To keep the control and its numerous properties organized, they have a deep hierarchy that you can access via inner properties and inner tags in the markup. The sections in the diagram below (Figure 1) show the main control hierarchy visually. You can find more information on the control’s rendering and appearance in this article about RadHtmlChart element structure.
If you are looking for detailed server-side API reference, examine the following articles, depending on the chart elements you wish to customize:
When looking for a way to customize a certain element of the chart look for inner tags and their attribute properties as well, not just at the attribute properties of the main element tag.
Figure 1: The hierarchical structure of the main RadHtmlChart tags.
Programmatic Chart Creation
In the sample below you will see how to create and configure a chart entirely on the server-side:
    protected void Page_Load(object sender, EventArgs e)
    {
        RadHtmlChart scatterChart = new RadHtmlChart();
        scatterChart.ID = "ScatterChart";
        scatterChart.Width = Unit.Pixel(680);
        scatterChart.Height = Unit.Pixel(400);

        scatterChart.Legend.Appearance.Position = Telerik.Web.UI.HtmlChart.ChartLegendPosition.Bottom;

        scatterChart.PlotArea.XAxis.TitleAppearance.Text = "Volts";
        scatterChart.PlotArea.YAxis.TitleAppearance.Text = "mA";

        ScatterLineSeries theoreticalData = new ScatterLineSeries();
        theoreticalData.Name = "Theoretical Data";
        theoreticalData.LabelsAppearance.Visible = false;
        theoreticalData.TooltipsAppearance.Color = System.Drawing.Color.White;
        theoreticalData.TooltipsAppearance.DataFormatString = "{0} Volts, {1} mA";

        for (int i = 0; i < 10; i++)
        {
            ScatterSeriesItem theoreticalItem = new ScatterSeriesItem(i, i+5);
            theoreticalData.SeriesItems.Add(theoreticalItem);
        }

        scatterChart.PlotArea.Series.Add(theoreticalData);
        Page.Form.Controls.Add(scatterChart);
    }
    Protected Sub Page_Load(ByVal sender As Object, ByVal e As EventArgs)
        Dim scatterChart As RadHtmlChart = New RadHtmlChart()
        scatterChart.ID = "ScatterChart"
        scatterChart.Width = Unit.Pixel(680)
        scatterChart.Height = Unit.Pixel(400)
        scatterChart.Legend.Appearance.Position = Telerik.Web.UI.HtmlChart.ChartLegendPosition.Bottom
        scatterChart.PlotArea.XAxis.TitleAppearance.Text = "Volts"
        scatterChart.PlotArea.YAxis.TitleAppearance.Text = "mA"
        Dim theoreticalData As ScatterLineSeries = New ScatterLineSeries()
        theoreticalData.Name = "Theoretical Data"
        theoreticalData.LabelsAppearance.Visible = False
        theoreticalData.TooltipsAppearance.Color = System.Drawing.Color.White
        theoreticalData.TooltipsAppearance.DataFormatString = "{0} Volts, {1} mA"

        For i As Integer = 0 To 10 - 1
            Dim theoreticalItem As ScatterSeriesItem = New ScatterSeriesItem(i, i + 5)
            theoreticalData.SeriesItems.Add(theoreticalItem)
        Next

        scatterChart.PlotArea.Series.Add(theoreticalData)
        Page.Form.Controls.Add(scatterChart)
    End Sub