Getting Started with the StockChart
This tutorial explains how to set up a basic Telerik UI for ASP.NET Core StockChart and highlights the major steps in the configuration of the component.
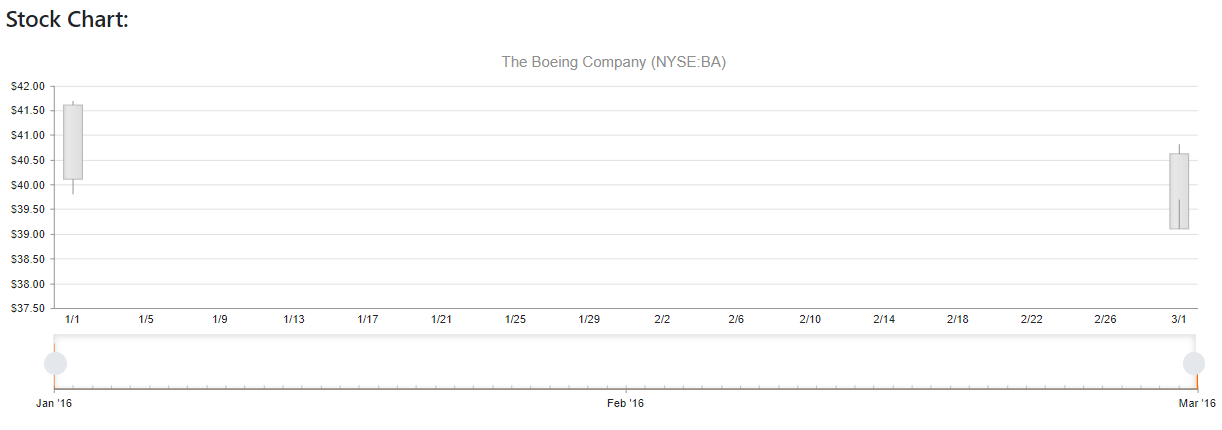
After completing this guide, you will achieve the following result:
1. Prepare the CSHTML File
Prerequisites
To successfully complete the tutorial, you need a project that is already configured to use the Telerik UI for ASP.NET Core components:
- To create a new pre-configured project for the Telerik UI for ASP.NET Core components, you can use a project template.
Optionally, you can structure the document by adding the desired HTML elements like headings, divs, paragraphs, and others.
    @using Kendo.Mvc.UI
    <h4>StockChart with a placeholder</h4>
    <div>

    </div>
    @addTagHelper *, Kendo.Mvc
    <h4>StockChart with a placeholder</h4>
    <div>

    </div>
2. Declare the View Model
Declare the StockDataPoint view model. The model must have a property field that represents the associated date of the entries. In this tutorial, this is the Date field.
    public class StockDataPoint
    {
        public DateTime Date { get; set; }

        public decimal Close { get; set; }

        public long Volume { get; set; }

        public decimal Open { get; set; }

        public decimal High { get; set; }

        public decimal Low { get; set; }

        public string Symbol { get; set; }
    }
3. Initialize the StockChart
Use the StockChart HtmlHelper or TagHelper to add the component to a page and set some of its options.
- Use the
Name()configuration method to assign a name to the instance of the helper—this is mandatory as its value is used for theidand thenameattributes of the StockChart element. - Add the
DataSource()configuration option and set theReadendpoint. - Configure the
Date()field to ensure that the date field is bound accordingly. - Incorporate the
Series()configuration and explicitly configure aCandleStick()chart series option. In order to correctly bind the data to the respective StockChart properties.
    @(Html.Kendo().StockChart<StockDataPoint>()
         .Name("stockChart")
         .Title("The Boeing Company (NYSE:BA)")
         .DataSource(ds => ds.Read(read => read
             .Action("_BoeingStockData", "Home")
         ))
         .DateField("Date")
         .Series(series =>
         {
             series.Candlestick(s => s.Open, s => s.High, s => s.Low, s => s.Close);
         })
    )
    <kendo-stockchart name="stockChart" date-field="Date">
        <chart-title text=" The Boeing Company (NYSE:BA)"></chart-title>
        <datasource>
            <transport>
                <read  url="@Url.Action("_BoeingStockData", "Home")"/>
            </transport>
            <schema>
                <model>
                    <fields>
                        <field name="Date" type="date"></field>
                        <field name="Close" type="number"></field>
                        <field name="Volume" type="number"></field>
                        <field name="Open" type="number"></field>
                        <field name="High" type="number"></field>
                        <field name="Low" type="number"></field>
                        <field name="Symbol" type="string"></field>
                    </fields>
                </model>
            </schema>
        </datasource>
        <series>
            <series-item type="ChartSeriesType.Candlestick" open-field="Open" high-field="High" low-field="Low"                 close-field="Close">
            </series-item>
        </series>
    </kendo-stockchart>
4. Add the StockChart Navigator
To add an additional pane that is placed at the bottom of the chart and can be used to change the date interval in the main panes, use the Navigator() option.
    @(Html.Kendo().StockChart<StockDataPoint>()
        .Name("stockChart")
        .Title("The Boeing Company (NYSE:BA)")
        .DataSource(ds => ds.Read(read => read
            .Action("_BoeingStockData", "Home")
        ))
        .DateField("Date")
        .Series(series =>
         {
             series.Candlestick(s => s.Open, s => s.High, s => s.Low, s => s.Close);
         })
        .Navigator(nav => nav
          .Series(series =>
          {
              series.Area(s => s.Volume);
          })
        )
    )
    <kendo-stockchart name="stockChart" date-field="Date">
        <chart-title text=" The Boeing Company (NYSE:BA)"></chart-title>
        <datasource>
            <transport>
                <read  url="@Url.Action("_BoeingStockData", "Home")"/>
            </transport>
            <schema>
                <model>
                    <fields>
                        <field name="Date" type="date"></field>
                        <field name="Close" type="number"></field>
                        <field name="Volume" type="number"></field>
                        <field name="Open" type="number"></field>
                        <field name="High" type="number"></field>
                        <field name="Low" type="number"></field>
                        <field name="Symbol" type="string"></field>
                    </fields>
                </model>
            </schema>
        </datasource>
        <series>
            <series-item type="ChartSeriesType.Candlestick" open-field="Open" high-field="High" low-field="Low" close-field="Close">
            </series-item>
        </series>
        <navigator>
            <navigator-series>
                <series-item type="ChartSeriesType.Area" field="Volume"></series-item>
            </navigator-series>
        </navigator>
    </kendo-stockchart>
5. Declare the Read Action
In the Home controller, declare the RemoteDataBindingData action that you set to the DataSource Read configuration in step 3.
    public IActionResult _BoeingStockData()
    {
        var data = new List<StockDataPoint>()
        {
            new StockDataPoint {
                Date= new DateTime(2016,1,1),
                Open= 41.62M,
                High= 41.69M,
                Low= 39.81M,
                Close= 40.12M,
                Volume= 2632000
            },
            new StockDataPoint {
                Date= new DateTime(2016,3,1),
                Open= 40.62M,
                High= 39.69M,
                Low= 40.81M,
                Close= 39.12M,
                Volume= 2631986
            }

        };

        return Json(data);
    }
6. Handle the StockChart Events
The StockChart exposes various events that you can handle and further customize the functionality of the component. In this tutorial, you will use the DataBound event of the StockChart.
    @(Html.Kendo().StockChart<StockDataPoint>()
        .Name("stockChart")
        .Title("The Boeing Company (NYSE:BA)")
        .Events((Action<Kendo.Mvc.UI.Fluent.StockChartEventBuilder>)(e => e.DataBound("onDataBound")))
        .DataSource(ds => ds.Read(read => read
            .Action("_BoeingStockData", "Home")
        ))
        .DateField("Date")
        .Series(series =>
         {
             series.Candlestick(s => s.Open, s => s.High, s => s.Low, s => s.Close);
         })
        .Navigator(nav => nav
          .Series(series =>
          {
              series.Area(s => s.Volume);
          })
        )
    )
    <kendo-stockchart name="stockChart" date-field="Date" on-data-bound="onDataBound">
        <chart-title text=" The Boeing Company (NYSE:BA)"></chart-title>
        <datasource>
            <transport>
                <read  url="@Url.Action("_BoeingStockData", "Home")"/>
            </transport>
            <schema>
                <model>
                    <fields>
                        <field name="Date" type="date"></field>
                        <field name="Close" type="number"></field>
                        <field name="Volume" type="number"></field>
                        <field name="Open" type="number"></field>
                        <field name="High" type="number"></field>
                        <field name="Low" type="number"></field>
                        <field name="Symbol" type="string"></field>
                    </fields>
                </model>
            </schema>
        </datasource>
        <series>
            <series-item type="ChartSeriesType.Candlestick" open-field="Open" high-field="High" low-field="Low" close-field="Close">
            </series-item>
        </series>
        <navigator>
            <navigator-series>
                <series-item type="ChartSeriesType.Area" field="Volume"></series-item>
            </navigator-series>
        </navigator>
    </kendo-stockchart>
    <script>
        function onDataBound(e) {
            console.log("StockChart data bound");
        }
    </script>
7. (Optional) Reference Existing StockChart Instances
To use the client-side API of the StockChart and build on top of its initial configuration, you need a reference to the StockChart instance. Once you get a valid reference, you can call the respective API methods:
-
Use the
.Name()(idattribute) of the component instance to get a reference.<script> var stockchartReference = $("#stockChart").data("kendoStockChart"); // stockchartReference is a reference to the existing instance of the helper. </script> -
Use the StockChart client-side API to control the behavior of the widget. In this example, you will use the
exportPDF()method to export the StockChart to a PDF file programmatically.<script> $(document).ready(function () { var stockchartReference = $("#stockChart").data("kendoStockChart"); // stockchartReference is a reference to the existing instance of the helper. stockchartReference.exportPDF(); // Export the StockChart to a PDF file. }) </script>