Data Binding
This article explains how to bind a 3D chart series to a collection of business objects. To data bound the series you can use its ItemsSource property. The property is of type IEnumerable so you can use most collection types.
The chart creates a DataPoint3D model for each business object in the ItemsSource collection. To map the properties of the business object to the DataPoint3D you can use the series value binding properties.
- XValueBinding: The binding that will be used to fill the data point model XValue property.
- YValueBinding: The binding that will be used to fill the data point model YValue property.
- ZValueBinding: The binding that will be used to fill the data point model ZValue property.
The properties are of type DataPointBinding which is an abstract class that has two implementations - PropertyNameDataPointBinding and GenericDataPointBinding.
The PropertyNameDataPointBinding expect a path (name) to a property in the business object of the data point. The binding class obtains the property using reflection, gets the corresponding value and assigns it to the data point model. This type of binding is used when you set the value binding properties in XAML.
Example 1: Using PropertyNameDataPointBinding
chartSeries3D.XValueBinding = new PropertyNameDataPointBinding("MyXValue");
Example 2: Setting PropertyNameDataPointBinding in XAML
<telerik:BarSeries3D XValueBinding="MyXValue"/>
Example 3: Using GenericDataPointBinding
chartSeries3D.XValueBinding = new GenericDataPointBinding<MyBusinessObject, double>()
{
    ValueSelector = x => x.MyXValue
};
In summary, to bind data to a 3D chart series, you will need to set 4 properties - YValueBinding, XValueBinding, ZValueBinding and ItemsSource.
Example 4: Setting binding properties in XAML
<telerik:BarSeries3D XValueBinding="MyXValue"
                     YValueBinding="MyYValue"
                     ZValueBinding="MyZValue"
                     ItemsSource="{Binding MyBusinessObjects}"/>
Complete Example
This section contains a complete data binding example.
Step 1: Create the business object for the data point
public class MyBusinessObject
{
    public double XValue { get; set; }
    public string YValue { get; set; }
    public double ZValue { get; set; }
}
Step 2: Set up the chart in XAML
<telerik:RadCartesianChart3D x:Name="chart">
    <telerik:RadCartesianChart3D.XAxis>
        <telerik:LinearAxis3D />
    </telerik:RadCartesianChart3D.XAxis>
    <telerik:RadCartesianChart3D.YAxis>
        <telerik:CategoricalAxis3D />
    </telerik:RadCartesianChart3D.YAxis>
    <telerik:RadCartesianChart3D.ZAxis>
        <telerik:LinearAxis3D />
    </telerik:RadCartesianChart3D.ZAxis>
    <telerik:RadCartesianChart3D.Grid>
        <telerik:CartesianChart3DGrid />
    </telerik:RadCartesianChart3D.Grid>

    <telerik:RadCartesianChart3D.Series>
        <telerik:BarSeries3D XValueBinding="XValue"
                             YValueBinding="YValue"
                             ZValueBinding="ZValue"
                             ItemsSource="{Binding}"/>
    </telerik:RadCartesianChart3D.Series>
</telerik:RadCartesianChart3D>
Step 3: Create a new collection and assing it to the DataContext of the chart
var source = new ObservableCollection<MyBusinessObject>();
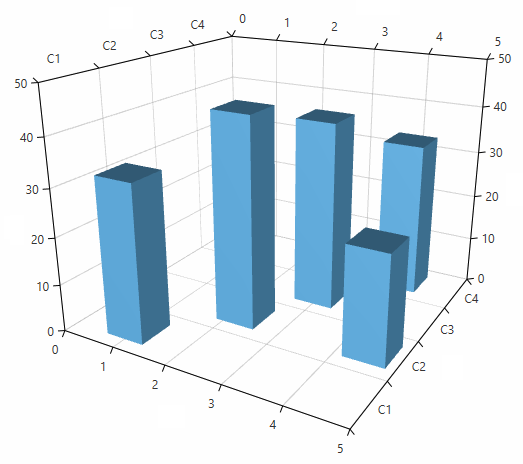
source.Add(new MyBusinessObject() { XValue = 1, YValue = "C1", ZValue = 33 });
source.Add(new MyBusinessObject() { XValue = 2.23, YValue = "C2", ZValue = 44 });
source.Add(new MyBusinessObject() { XValue = 3, YValue = "C3", ZValue = 40 });
source.Add(new MyBusinessObject() { XValue = 4, YValue = "C4", ZValue = 33 });
source.Add(new MyBusinessObject() { XValue = 4.5, YValue = "C2", ZValue = 23 });
chart.DataContext = source;
Figure 1: Data bound BarSeris3D