Getting Started with WPF ChartView3D
This article will walk you through the creation of a sample application that contains a RadCartesianChart3D component.
Assembly References
In order to use RadCartesianChart3D, you will need to add references to the following assemblies:
- Telerik.Windows.Controls
- Telerik.Windows.Controls.Chart
- Telerik.Windows.Data
You can find the required assemblies for each control from the UI for WPF suite in Controls Dependencies help article.
Defining chart and axes
To display the RadCartesianChart3D you will need to define it along with its axes (see Example 1). You can find more information about the chart's axes in the Axes help article.
Example 1: Empty RadCartesianChart3D
<telerik:RadCartesianChart3D>
    <telerik:RadCartesianChart3D.XAxis>
        <telerik:LinearAxis3D />
    </telerik:RadCartesianChart3D.XAxis>
    <telerik:RadCartesianChart3D.ZAxis>
        <telerik:LinearAxis3D />
    </telerik:RadCartesianChart3D.ZAxis>
    <telerik:RadCartesianChart3D.YAxis>
        <telerik:LinearAxis3D />
    </telerik:RadCartesianChart3D.YAxis>
</telerik:RadCartesianChart3D>
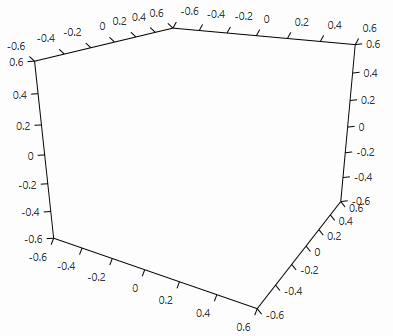
At this point the viewport of the chart is rendered.
Figure 1: Empty chart
Defining chart series
The data in the chart is presented with the chart series objects. You can find more information about this in the Series section of the help documentation.
Example 2: Defining series
<telerik:RadCartesianChart3D>
    <telerik:RadCartesianChart3D.XAxis>
        <telerik:LinearAxis3D />
    </telerik:RadCartesianChart3D.XAxis>
    <telerik:RadCartesianChart3D.ZAxis>
        <telerik:LinearAxis3D />
    </telerik:RadCartesianChart3D.ZAxis>
    <telerik:RadCartesianChart3D.YAxis>
        <telerik:LinearAxis3D />
    </telerik:RadCartesianChart3D.YAxis>
    <telerik:RadCartesianChart3D.Series>
        <telerik:PointSeries3D PointSize="60 60 60">
            <telerik:PointSeries3D.DataPoints>
                <telerik:XyzDataPoint3D XValue="66" YValue="48" ZValue="81" />
                <telerik:XyzDataPoint3D XValue="94" YValue="15" ZValue="67" />
                <telerik:XyzDataPoint3D XValue="26" YValue="32" ZValue="21" />
                <telerik:XyzDataPoint3D XValue="25" YValue="72" ZValue="59" />
                <telerik:XyzDataPoint3D XValue="15" YValue="73" ZValue="24" />
                <telerik:XyzDataPoint3D XValue="65" YValue="32" ZValue="17" />
                <telerik:XyzDataPoint3D XValue="20" YValue="44" ZValue="29" />
                <telerik:XyzDataPoint3D XValue="31" YValue="10" ZValue="43" />
                <telerik:XyzDataPoint3D XValue="17" YValue="55" ZValue="39" />
                <telerik:XyzDataPoint3D XValue="52" YValue="40" ZValue="94" />
                <telerik:XyzDataPoint3D XValue="98" YValue="60" ZValue="68" />
                <telerik:XyzDataPoint3D XValue="87" YValue="40" ZValue="35" />
                <telerik:XyzDataPoint3D XValue="20" YValue="27" ZValue="87" />
                <telerik:XyzDataPoint3D XValue="88" YValue="35" ZValue="87" />
                <telerik:XyzDataPoint3D XValue="91" YValue="60" ZValue="51" />
            </telerik:PointSeries3D.DataPoints>
        </telerik:PointSeries3D>
    </telerik:RadCartesianChart3D.Series>
</telerik:RadCartesianChart3D>
Figure 2: PointSeries3D
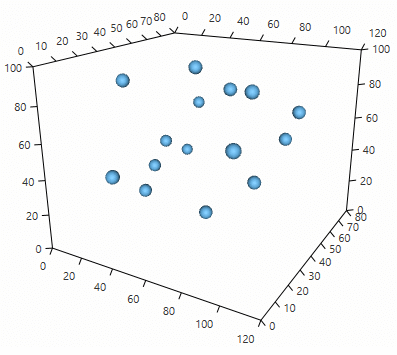
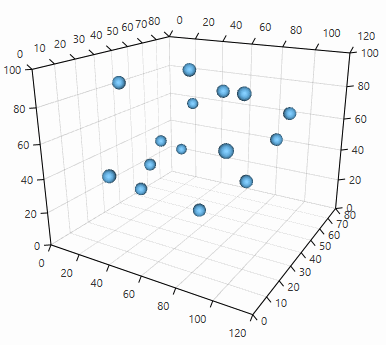
For precisely reading the elements in the 3D space you can enable the chart's grid. You can read more about this in the Chart Grid help article.
Example 3: Adding chart grid
<telerik:RadCartesianChart3D.Grid>
    <telerik:CartesianChart3DGrid />
</telerik:RadCartesianChart3D.Grid>
Figure 3: Chart grid
Data binding
This section demonstrates how to setup the chart from Example 1, but in a data binding scenario.
Example 4: Define the data points model
public class PlotInfo
{
    public double XValue { get; set; }
    public double YValue { get; set; }
    public double ZValue { get; set; }
}
Example 5: Set up the DataContext of the view
var source = new ObservableCollection<PlotInfo>()
{
    new PlotInfo() { XValue = 66, YValue = 48, ZValue = 81 },
    new PlotInfo() { XValue = 94, YValue = 15, ZValue = 67 },
    new PlotInfo() { XValue = 26, YValue = 32, ZValue = 21 },
    new PlotInfo() { XValue = 25, YValue = 72, ZValue = 59 },
    new PlotInfo() { XValue = 15, YValue = 73, ZValue = 24 },
    new PlotInfo() { XValue = 65, YValue = 32, ZValue = 17 },
    new PlotInfo() { XValue = 20, YValue = 44, ZValue = 29 },
    new PlotInfo() { XValue = 31, YValue = 10, ZValue = 43 },
    new PlotInfo() { XValue = 17, YValue = 55, ZValue = 39 },
    new PlotInfo() { XValue = 52, YValue = 40, ZValue = 94 },
    new PlotInfo() { XValue = 98, YValue = 60, ZValue = 68 },
    new PlotInfo() { XValue = 87, YValue = 40, ZValue = 35 },
    new PlotInfo() { XValue = 20, YValue = 27, ZValue = 87 },
    new PlotInfo() { XValue = 88, YValue = 35, ZValue = 87 },
    new PlotInfo() { XValue = 91, YValue = 60, ZValue = 51 },
};

this.series.DataContext = source;
Example 6: Set up the view
<telerik:RadCartesianChart3D>
    <telerik:RadCartesianChart3D.XAxis>
        <telerik:LinearAxis3D />
    </telerik:RadCartesianChart3D.XAxis>
    <telerik:RadCartesianChart3D.ZAxis>
        <telerik:LinearAxis3D />
    </telerik:RadCartesianChart3D.ZAxis>
    <telerik:RadCartesianChart3D.YAxis>
        <telerik:LinearAxis3D />
    </telerik:RadCartesianChart3D.YAxis>
    <telerik:RadCartesianChart3D.Grid>
        <telerik:CartesianChart3DGrid />
    </telerik:RadCartesianChart3D.Grid>
    <telerik:RadCartesianChart3D.Series>
        <telerik:PointSeries3D x:Name="series"
                               PointSize="60 60 60"
                               XValueBinding="XValue"
                               YValueBinding="YValue"
                               ZValueBinding="ZValue"
                               ItemsSource="{Binding}"/>
    </telerik:RadCartesianChart3D.Series>
</telerik:RadCartesianChart3D>
Setting chart size
The size of the chart's plot area can be changed via the PlotAreaSize property of the chart. The property is of type System.Windows.Media.Media3D.Size3D, thus allowing you to set all 3 dimensions of the area.
Example 7: Setting PlotAreaSize
<telerik:RadCartesianChart3D PlotAreaSize="500, 500, 500"/>
The plot area is the space locked between the axes, where the series are drawn.
Camera behavior
In order to interact with the chart's scene you can use the Chart3DCameraBehavior. You can find more information about this in the Camera Behavior article.
Example 8: Defining camera behavior
<telerik:RadCartesianChart3D.Behaviors>
    <telerik:Chart3DCameraBehavior />
</telerik:RadCartesianChart3D.Behaviors>
Telerik UI for WPF Learning Resources
- Telerik UI for WPF 3DChart Component
- Getting Started with Telerik UI for WPF Components
- Telerik UI for WPF Installation
- Telerik UI for WPF and WinForms Integration
- Telerik UI for WPF Visual Studio Templates
- Setting a Theme with Telerik UI for WPF
- Telerik UI for WPF Virtual Classroom (Training Courses for Registered Users)
- Telerik UI for WPF License Agreement