Reports
Report Definitions
In the Report Definitions you see a list of all predefined report definitions. They are sorted first by Favorites (the star icon) and then by the last saved or created definition. Each definition shows a report for one or more test lists and for the specified time frame.
The definitions, marked as favorites, are saved locally per browser.
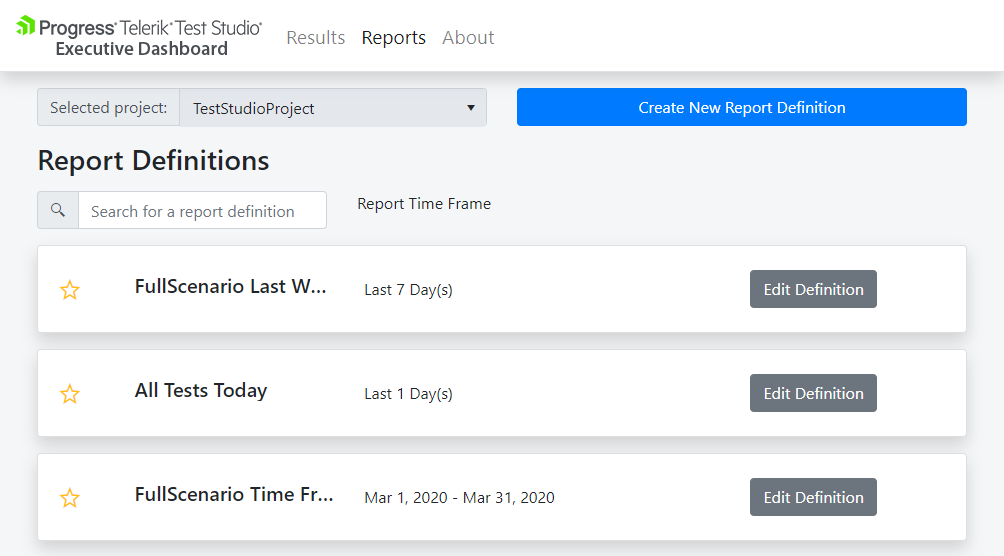
- Select project - Select a Test Studio project from a drop-down list.
- Create New Report Definition - Opens the Create Report Definition, where you can define new report.
- Search field - Filter report definitions by name as you type.
- Favorites - Enable/Disable favorites for a report definition. Favorite report definitions will always appear on top.
- Edit Definition - Opens the Edit Report Definition, where you can modify the selected report definition.
Create Report Definition
From this view you can create new report definitions for one or more test lists. You can choose the date range for the report details, or use a sliding period to generate a dynamic report for the last days, weeks or months.
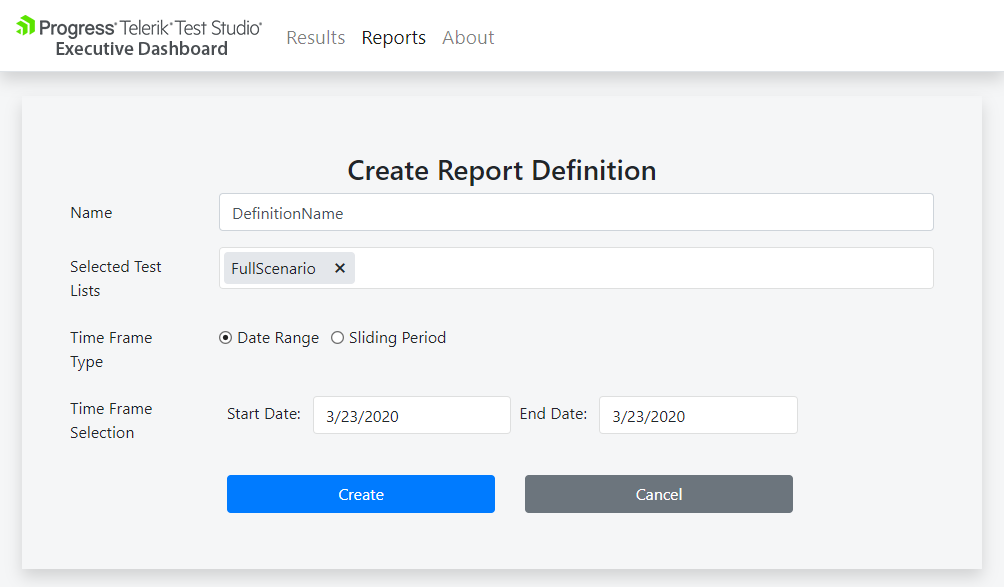
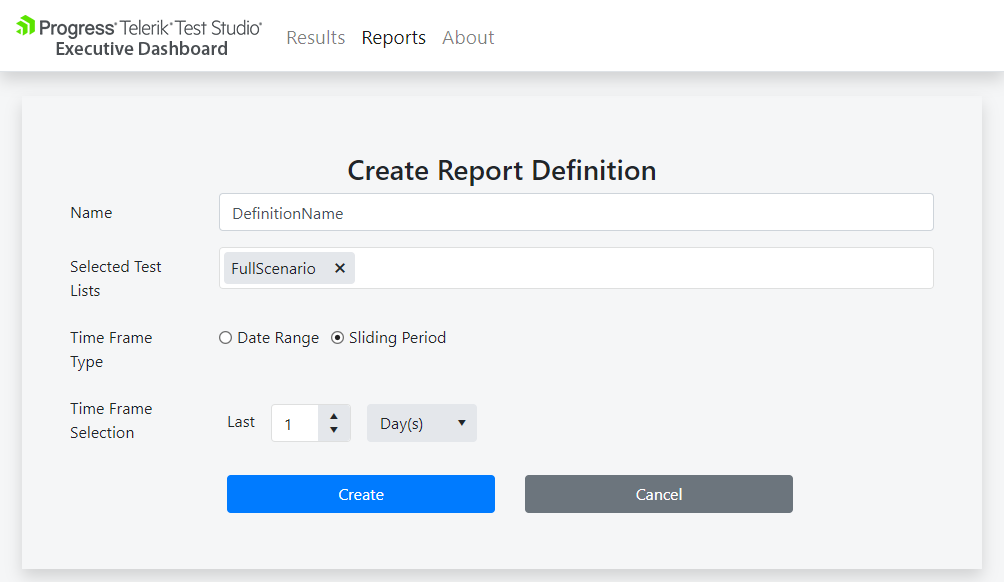
- Name - Type the name of the report definition that will be created.
- Selected Test Lists - Select one or more test lists that will be included in the report.
- Time Frame Type - You can chose between a fixed date range or a dynamic sliding period.
- Time Frame Selection - This option depends on the Time Frame Type selection. Data range allows you to choose a start and end date. The Sliding period allows you to specify a dynamically changing report for the last days, weeks or months.
- Create - Creates the new report definition. This will also generate and open the report, based on the configuration.
- Cancel - Returns back to the previous page without saving the report definition.
Edit Report Definition
Here you can make changes to an already existing report definition or delete it. All fields are available to be modified and will be updated, when you save the report definition.
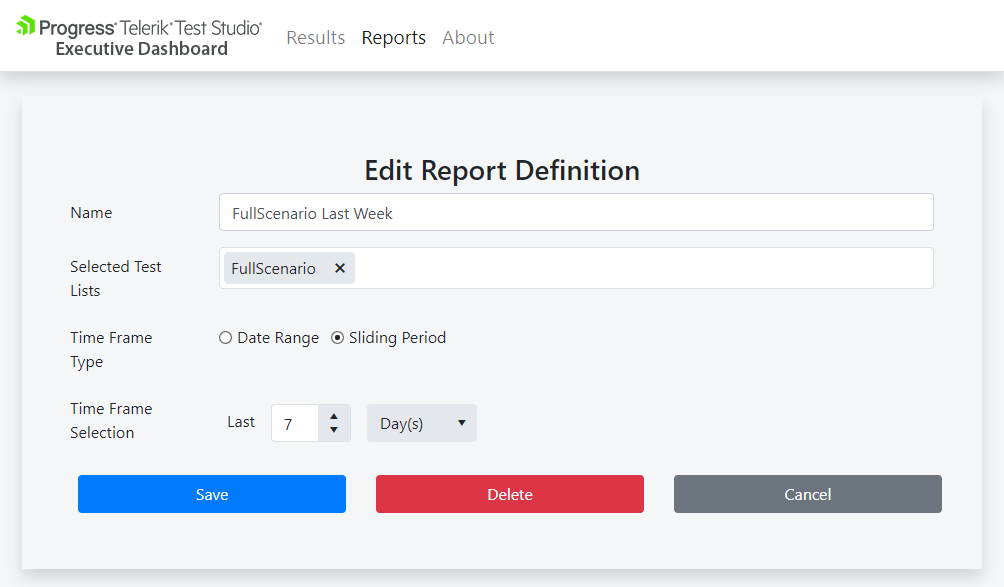
- Name - Type the name of the report definition that will be created.
- Selected Test Lists - Select one or more test lists that will be included in the report.
- Time Frame Type - You can chose between a fixed date range or a dynamic sliding period.
- Time Frame Selection - This option depends on the Time Frame Type selection. Data range allows you to choose a start and end date. The Sliding period allows you to specify a dynamically changing report for the last days, weeks or months.
- Save - Saves your changes to this report definition. This will also generate and open the report, based on the configuration.
- Delete - Deletes the report definition.
- Cancel - Returns back to the previous page without saving the report definition.
Report Detail
You can analyze the report details and export it to PDF format, using the Export To PDF button. The report is devided into two main sections - Report Overview and Test List Details.
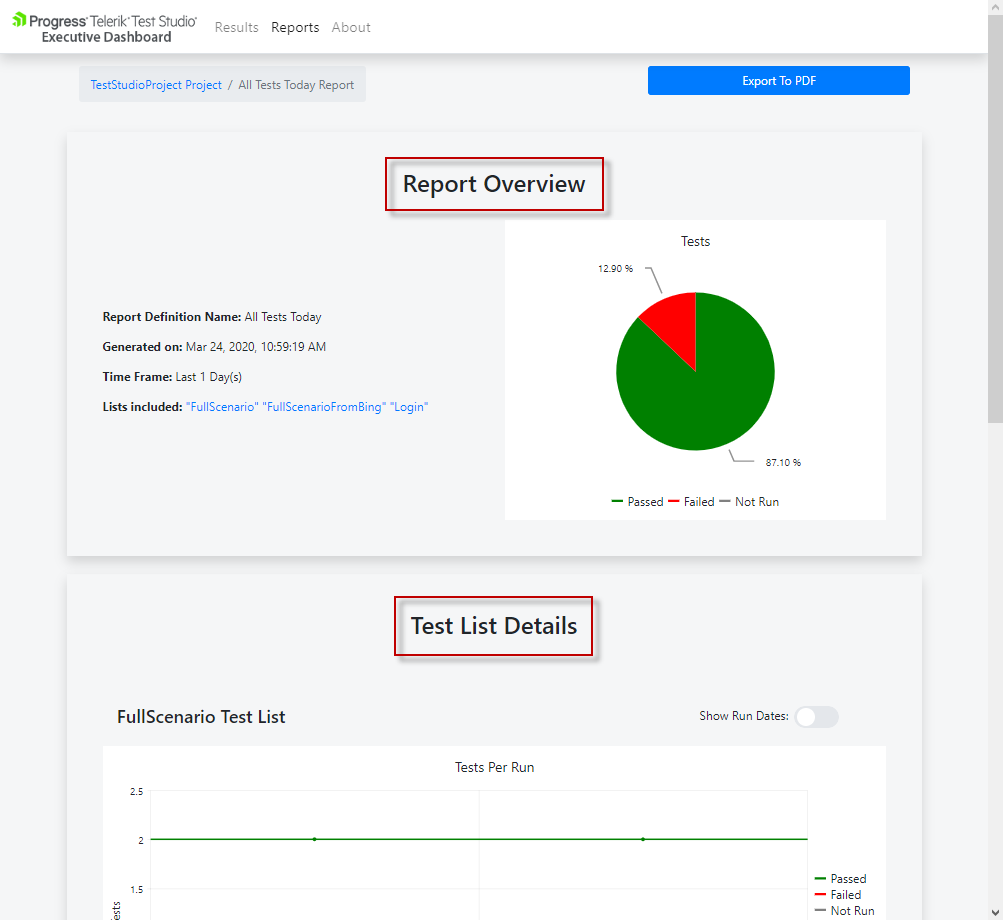
- Breadcrumb navigation - Click on the Project name link to navigate back.
- Export To PDF - Export the current state of the report to PDF format.
Report Overview
The Report Overview shows you details about the current report definition and a pie chart of all executed tests. The pie chart is divided by the percentage (%) of tests that passed, failed or were not ran. You can also hover over each section to show you the exact number of tests in that section.
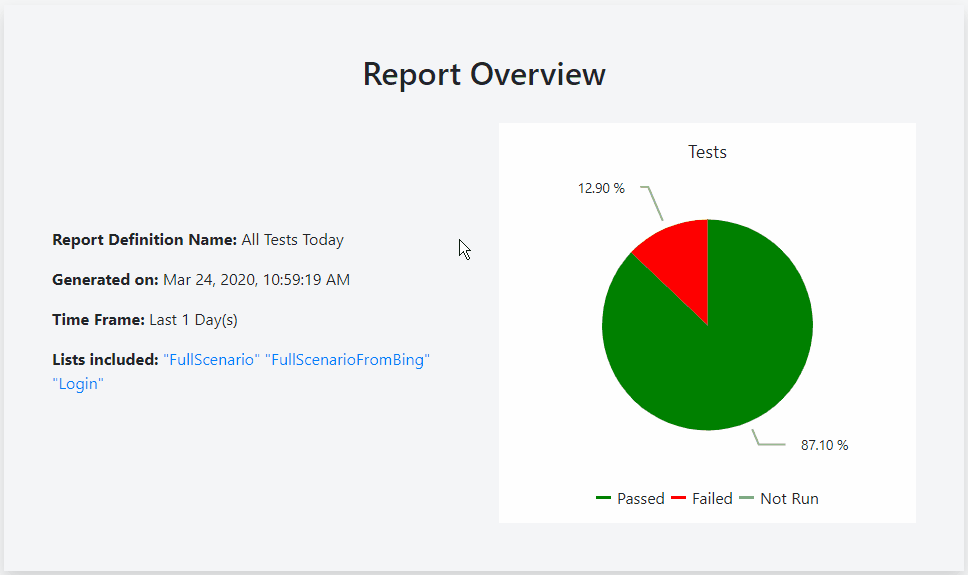
- Report Definition Name - The custom name of the report definition.
- Generated on - Shows the date and time, when the current report was generated. It is generated again every time you open it.
- Time Frame - Indicates the time frame of the current report definition, based on the Time Frame Type and Selection.
- Lists Included - A list of all test lists that are included in the current report.
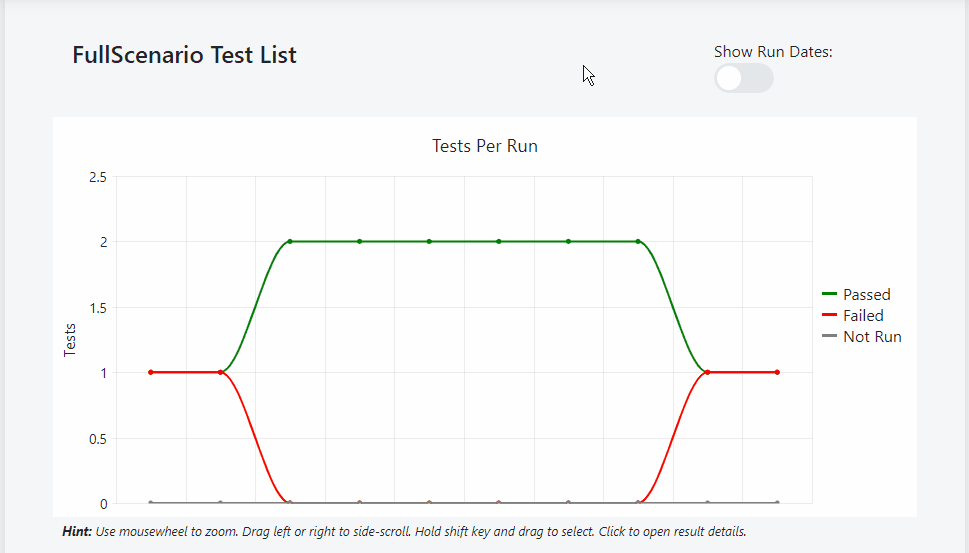
Test List Details
Every test list has a graphic that shows passed, failed and not ran tests. The graphic shows the number of tests executed in the vertical (Y) axis and the time and date of each test list run on the horizontal (X) axis. You can also use the following actions against the graphic:
- Show/Hide test list run dates from the toggle button Show Run Dates.
- Use the mouse wheel to zoom in and out.
- While the graphic is zoomed in, you can drag it left or right to side-scroll.
- Press the Shift key and drag to select a section of the graphic.
- Open the test list results, by clicking on the test list execution in the graphic.