How to Use the Visual Debugger
The Visual Debugger is a useful tool, which allows you to debug a test while it is being executed. By default it is enabled for each quick test execution. It appears at the bottom right corner of the active display (right above the Windows system tray) and shows the progress of the executed steps.
The Visual Debugger tool provides a bunch of useful options to troubleshoot a failing step in test run-time and this article describes these in details.
Enable/Disable the Visual Debugger Tool
The default state of the Visual Debugger is enabled and it will appear for each quick test run triggered from the Execute button. Since it appears on top of all other applications running on the desktop, including the execution browser, you may need to disable it in certain occasions. An example is a maximized browser and a test script, which interacts with controls on the page, which remain under the Visual Debugger tool. Use the Debugger toggle button in the Test tools ribbon to enable or disable it.

Set Auto-Pause Rule for the Visual Debugger
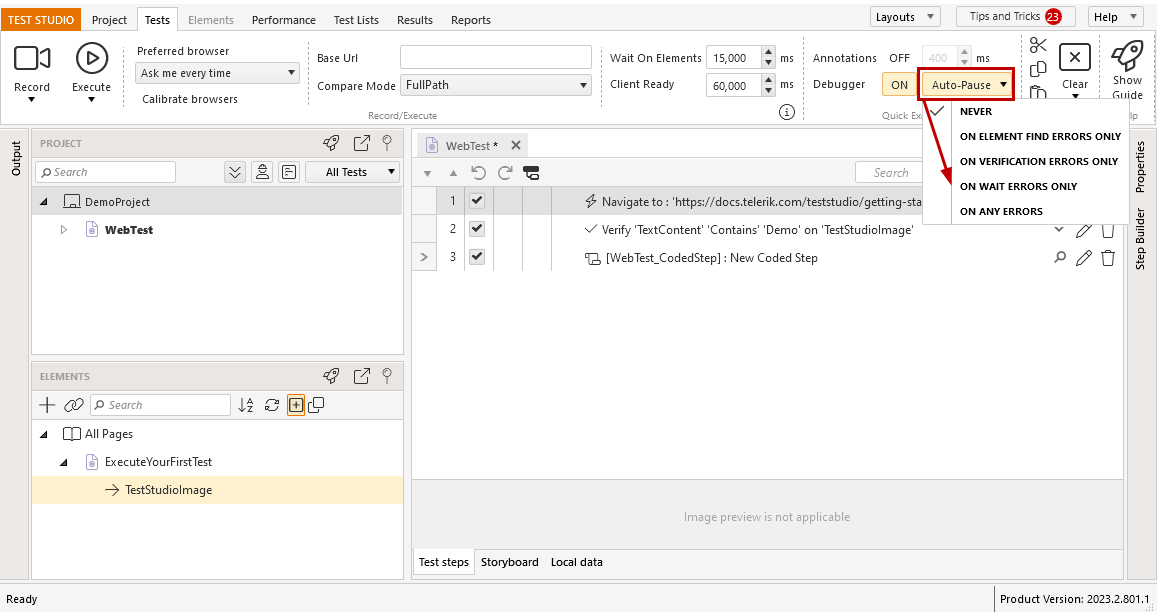
The Visual Debugger can be stopped manually at any time of the test run using the Pause button in the tool. For your convenience, Test Studio provides few options to auto-pause the execution and allow you explore the momentum state of the application. The predefined rules, which can trigger the pause of the test run are:
- On Element Find Errors Only
- On Verification Errors Only
- On Wait Errors Only
- On Any Errors
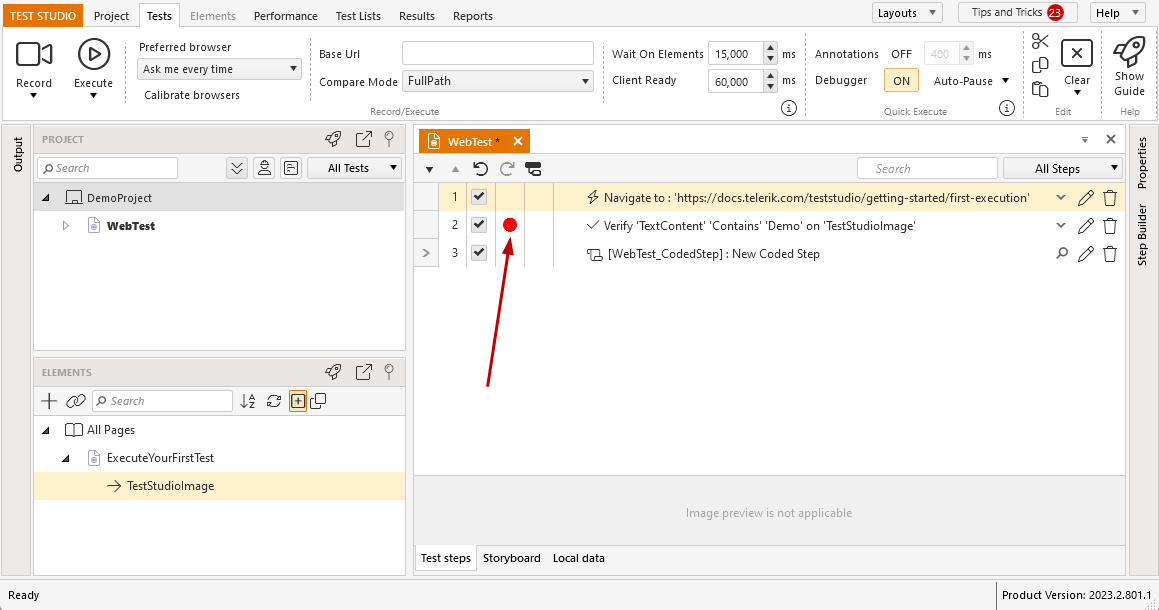
Set Breakpoint
Along with these specific errors, you can choose any step from a test, prior which execution you want to pause the execution, and set a breakpoint for it. The breakpoint for a step indicates pausing the test before the step is executed, if the Visual Debugger is enabled for the test run.
Manually Pause the Test
If you haven't set any of the auto-pause options, you can manually pause the test run - hit the Pause button directly in the Debugger tool.

Note
The test run will be paused once the listed current step execution finishes. So, if this a failing step, which uses a timeout, before it reports the failure, the pause will be applied after the timeout passes.
Make Use of the Visual Debugger Tool Options During Test Run
Once the test pauses, regardless if this is an auto-pause or a manual trigger of the Pause button, the following Debug Options are available:
-
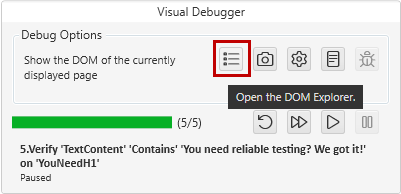
Show the DOM Explorer of the currently displayed page. This can help identify the correct find logic for a particular element, or whether a desired element is missing.
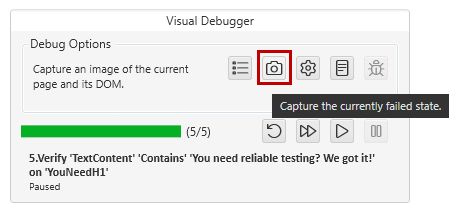
-
Capture the currently failed state. Save a .zip file containing a snapshot of the DOM, browser image, and test log. You can use this complete record of the current page state to communicate it to a third party, such as a developer in your organization, or a Test Studio support engineer.
-
Diagnose a failure directly. Only enabled on detected failures.
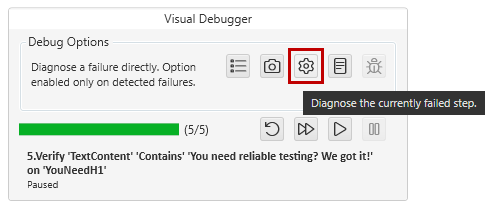
- Opens the Sentence Verification Builder for failed Verifications.
- Opens the Find Element dialog for Unable to locate element failures. In combination with the DOM Explorer, this find logic can help diagnose steps that fail due to faulty find expressions.
-
View the current execution log of the test. Displays the execution log at the time of the current step. Since the execution log contains details on step failure, it can act as a starting point in your debugging. For example, if the failure log contains an 'Element does not exist' exception, you can check to see if the element is missing altogether or whether the step used bad find logic.
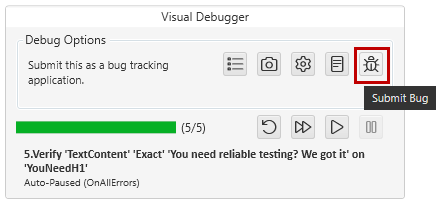
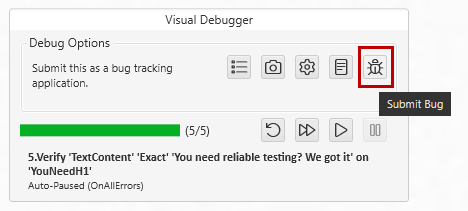
-
Send bugs directly to a bug tracker. Only enabled, if you have configured a bug tracker for the project. Opens the Submit a Bug dialog, so you can easily record any bugs in the bug tracking app during debugging.
Resume the Test Execution
Once finished with debugging process for the current step, you have few options to continue the test execution.
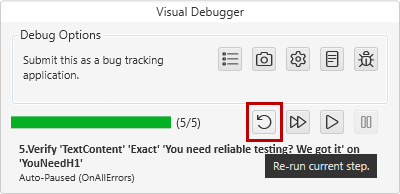
-
Re-run current step using the Rerun button.
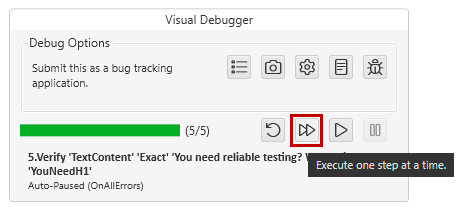
-
Execute one step at a time using the Fast Forward button.
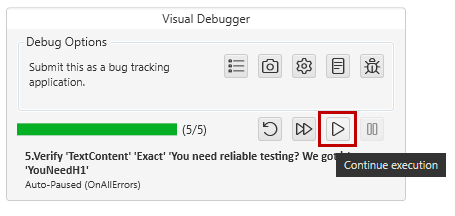
-
Resume normal execution using the Play button.