Enable Visual Debugger
The Test Ribbon in Test Studio allows you to trigger a quick test execution. Along with that it provides quick access to some useful project settings.
The Visual Debugger is a useful tool to help you explore the application, while a test is being executed. It provides different options when to pause the test run and allows you to explore the current DOM tree, so far generated results, etc. The debugging options for your next test run can be controlled from the Test ribbon in Test Studio.
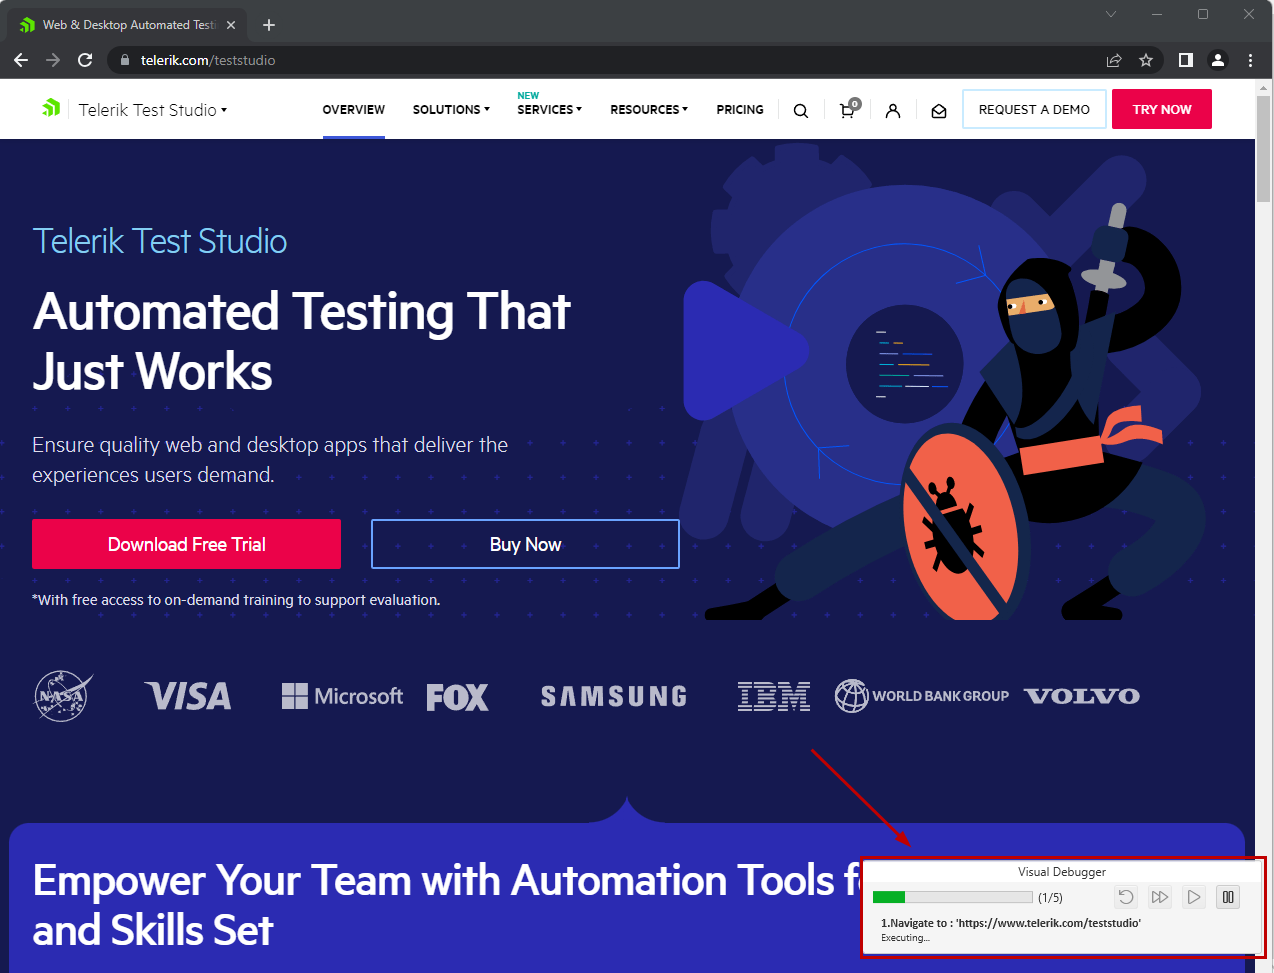
Visual Debugger
The Visual Debugger is enabled by default and it appears in the lower right corner of your screen. It indicates the current step, includes play and pause ability, and shows additional Debug Options if you set a Breakpoint to any step. This is a feature you could turn on or off.
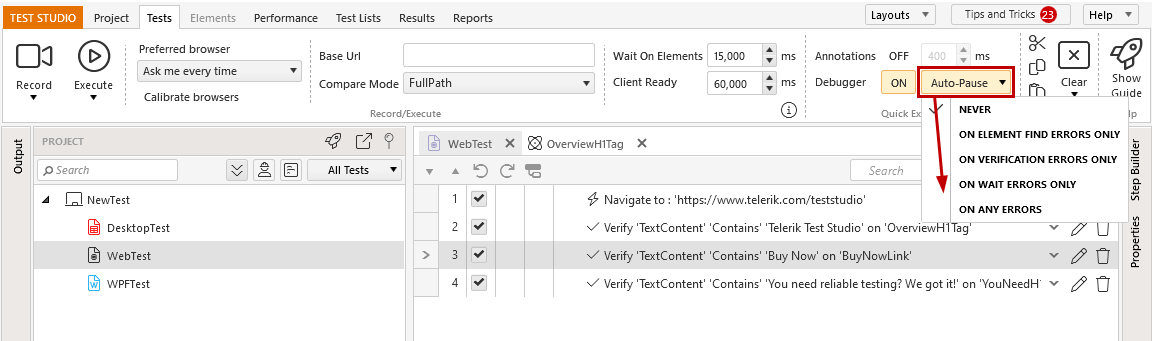
Debugger Options
Click Debugging Options icon in the Test ribbon to turn the debugger on or off, and customize the Auto-Pause Options, if errors occur during the execution.