Shapes
The Diagram enables you to add various shapes by using its API reference on shapes.
Getting Started
To add a rectangular shape to the Diagram, call the diagram.addShape(); method which renders a rectangle in the upper-left corner of the Diagram surface. To change the initial position, call the addShape() method with an additional Point parameter.
var Point = kendo.dataviz.diagram.Point;
diagram.addShape(new Point(100,220));
To specify additional properties for the Diagram, use the options parameter. The following example demonstrates how to set the background color of the shape.
diagram.addShape(new Point(100,220), { background: "red" });The addShape() method also accepts a shape instance and enables you to add a new shape.
var Point = kendo.dataviz.diagram.Point;
var shapeInstance = new kendo.diagram.Shape();
var shape = diagram.addShape(shape);
shape.position(new Point(100,220));
Adding Connections
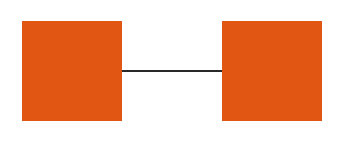
To connect the shapes, use the connect() method.
var Point = kendo.dataviz.diagram.Point;
var shape1 = diagram.addShape(new Point(100,100));
var shape2 = diagram.addShape(new Point(300,100));
var connection = diagram.connect(shape1, shape2);
The previous example results in the following output.

Changing the Initial Options of the Shape
To change a particular configuration of the shape and visualize it, use the redraw() method which will render the shape with its new options.
var shape = new kendo.dataviz.diagram.Shape({x: 500, y: 100, fill: "green"});
diagram.addShape(shape);
diagram.shapes[0].redraw({
fill: {
    color: "red"
}
});
Cloning a Shape
To make a clone of a shape and render it on the Diagram, use the clone() method.
var shape = new kendo.dataviz.diagram.Shape({x: 500, y: 100, fill: "green"});
diagram.addShape(shape);

var shape2 = diagram.shapes[0].clone();
diagram.addShape(shape2);
Creating a Shape Using SVG Path Data
To create a Diagram shape with an SVG Path, use the path configuration.
var shape = new kendo.dataviz.diagram.Shape({path: 'm35.15,0 L84.85,0 L120,35.15 L120,84.85 L84.85,120 L35.15,120 L0,84.85 L0,35.15 z', fill: "green"});
diagram.addShape(shape);