Sankey Diagram Overview
The Kendo UI for jQuery Sankey Diagram allows you to create diagrams that visualize changing flows and their distribution between domains. Sankey diagrams suit a variety of use cases like the representation of website traffic, budget breakdowns, energy flow, and others.
The Sankey is part of Kendo UI for jQuery, a
professional grade UI library with 110+ components for building modern and feature-rich applications. To try it out sign up for a free 30-day trial.
![]()
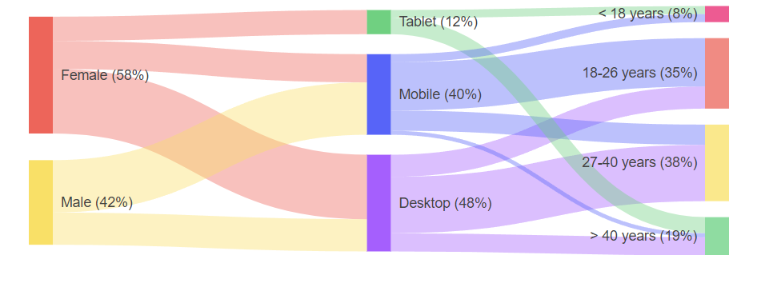
The Kendo UI for jQuery Sankey Diagram includes the following customizable elements:
- Nodes—The node is a rectangular element that connects to other nodes.
- Links—The lines that connect the nodes to each other. The greater the value of the link, the greater the width of the link will be.
- Labels—The labels are the names of the nodes and are displayed on them or next to them.
- Legend—The legend lists the labels of each link.
- Title—The title displayed above the component.
- Tooltip—The tooltip is displayed when hovering above the links and nodes.
Functionality and Features
- Customization—You can customize the links, the nodes, and the labels of the Sankey Diagram.