Getting Started with WPF Diagram
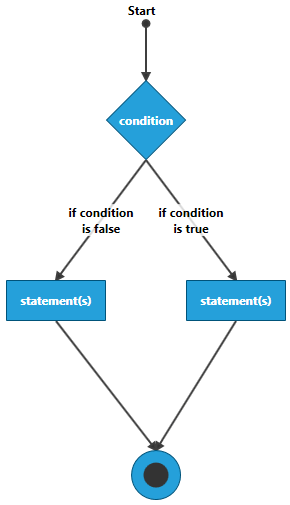
Telerik RadDiagrams are a powerful diagramming framework that can bring to life your rich data-visualization scenarios. This tutorial will walk you through the main concepts and tools of the diagramming framework and help you to create the flow diagram of an "if-else" operator.
Figure 1: Flow diagram example
Adding Telerik Assemblies Using NuGet
To use RadDiagram when working with NuGet packages, install the Telerik.Windows.Controls.Diagrams.for.Wpf.Xaml package. The package name may vary slightly based on the Telerik dlls set - Xaml or NoXaml
Read more about NuGet installation in the Installing UI for WPF from NuGet Package article.
With the 2025 Q1 release, the Telerik UI for WPF has a new licensing mechanism. You can learn more about it here.
Adding Assembly References Manually
If you are not using NuGet packages, you can add a reference to the following assemblies:
- Telerik.Licensing.Runtime
- Telerik.Windows.Controls
- Telerik.Windows.Controls.Diagrams
- Telerik.Windows.Diagrams.Core
To use the RadDiagram MVVM support or one of the extensions tools like the settings pane or the toolbox you will need to add reference also to the following assemblies:
- Telerik.Windows.Controls.Diagrams.Extensions
- Telerik.Windows.Controls.Input
- Telerik.Windows.Controls.Navigation
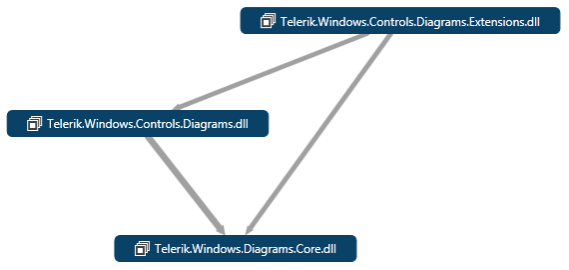
The following picture shows the interdependency between the RadDiagram main assemblies. Note that the Telerik.Windows.Controls.Diagrams.Extensions relies also on Telerik.Windows.Controls.Input and Telerik.Windows.Controls.Navigation.
Figure 2: Interdependency of the RadDiagram control main assemblies
You can find more info about the Telerik UI for WPF dependencies in the Controls Dependencies help article.
Graph Object Model
The Graph Object Model is the main concept behind the diagramming framework. It contains the following three main objects:
Graph - this is the structure that contains the RadDiagramShapes and RadDiagramConnections. In the Telerik Diagramming Framework, the graph is represented by the RadDiagram class.
Shape - the shape describes a node of a Graph that in the Telerik Diagramming Framework is represented by the RadDiagramShape class.
Connection - the connection describes the edges of the graph and it is basically an object that connects zero, one or two shapes. In the Telerik Diagramming Framework, the connection is represented by the RadDiagramConnection class.
The RadDiagram items are represented by the RadDiagramItem class. Therefore, both RadDiagramConnection and RadDiagramShape classes derive from the RadDiagramItem class.
In order to populate the RadDiagram with RadDiagramItems, you can add RadDiagramShapes and RadDiagramConnections in the RadDiagram.Items collection from code-behind (read more) or declaratively in xaml (read more). Also, because the RadDiagram control is a data-driven control, it supports data binding. In order to bind the RadDiagram to a collection, you can use its GraphSource property. Note that when the GraphSource property is set, the Items collection is made read-only and fixed-size. For more information, please refer to the DataBinding tutorial.
Please note that the examples in this tutorial are showcasing the Telerik Windows8 theme. In the Setting a Theme article you can find more information on how to set an application-wide theme.
Setting Up the Drawing Canvas
Before proceeding with adding RadDiagram to your project, make sure the required assembly references are added to the project. When you want to create a diagram in your application, you first need to add the RadDiagram control, as it represents the main canvas onto which the diagramming tools and shapes are drawn.
Example 1: Adding RadDiagram in XAML
<telerik:RadDiagram />
Figure 3: Default drawing canvas:

RadDiagram exposes a set of properties that allow you to customize the graph layout and operations. For example, you can set up the active mouse tool, specify if a cut, copy, paste or delete operation is allowed, and customize the background color, the cells' height and width as well as the GridLine thickness of the drawing canvas.
Adding RadDiagramShapes
In order to create a diagram describing the flow of an "if-else" operator, you will need four shapes - two will represent the statements, one will describe the condition and one will represent the final result of the operator.
Let's start with the condition of the "if-else" operator. In a block diagram, a condition is usually described by a diamond shape, called a decision shape.
The RadDiagramShape exposes a Geometry property that allows you to create a custom geometry or use predefined shape geometry. The predefined shape geometries in the Telerik Diagramming Framework are described by the ArrowShape, CommonShape and FlowChartShape extension classes. For more information, pelase refer to the DiagramShapes tutorial.
Example 2: Adding RadDiagramShape in XAML
<telerik:RadDiagram>
    <telerik:RadDiagramShape Geometry="{telerik:FlowChartShape ShapeType=DecisionShape}" />
</telerik:RadDiagram>
Figure 4: DecisionShape default visual look

You can define the size of the shape and set its Content and x:Name properties to better describe it.
Example 3: Customize DecisionShape in XAML
<telerik:RadDiagram>
    <telerik:RadDiagramShape x:Name="ConditionShape"
                             Width="80"
                             Height="80"
                             Content="condition"
                             FontWeight="Bold"
                             Geometry="{telerik:FlowChartShape ShapeType=DecisionShape}" />
</telerik:RadDiagram>
Figure 5: Customized DecisionShape visual look

To describe the statements of the "if-else" operator you can use the default geometry of the RadDiagramShape.
Example 4: Setting default geometry of the RadDiagramShape in XAML
<telerik:RadDiagram>
    <telerik:RadDiagramShape x:Name="ConditionShape"
                             Width="80"
                             Height="80"
                             Content="condition"
                             FontWeight="Bold"
                             Geometry="{telerik:FlowChartShape ShapeType=DecisionShape}" />
    <telerik:RadDiagramShape x:Name="StatementShape1"
                             Width="100"
                             Content="statement(s)"
                             FontWeight="Bold" />
    <telerik:RadDiagramShape x:Name="StatementShape2"
                             Width="100"
                             Content="statement(s)"
                             FontWeight="Bold" />
</telerik:RadDiagram>
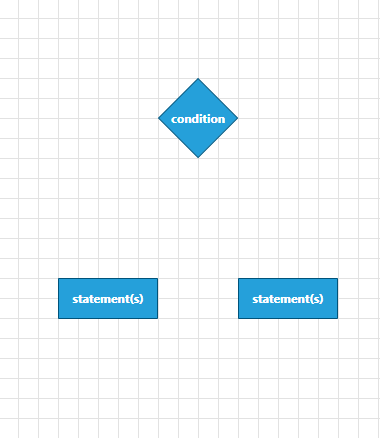
Figure 6: RadDiagramShapes without its Position property set

Adding multiple shapes in the RadDiagram without setting their position, by default, will position all shapes at the top left corner of the drawing canvas. In order to rearrange their layout, you need to set the Position property of each shape. This property is of type Point and it gets or sets the coordinates of the top left point of a shape.
Example 5: Set the Position property in XAML
<telerik:RadDiagram>
    <telerik:RadDiagramShape x:Name="ConditionShape"
                             Width="80"
                             Height="80"
                             Content="condition"
                             FontWeight="Bold"
                             Geometry="{telerik:FlowChartShape ShapeType=DecisionShape}"
                             Position="160,80" />
    <telerik:RadDiagramShape x:Name="StatementShape1"
                             Width="100"
                             Content="statement(s)"
                             FontWeight="Bold"
                             Position="60,280" />
    <telerik:RadDiagramShape x:Name="StatementShape2"
                             Width="100"
                             Content="statement(s)"
                             FontWeight="Bold"
                             Position="240,280" />
</telerik:RadDiagram>
Figure 7: RadDiagramShape with its Position property set
To describe the final result of the operator you can use an ellipse shape. Telerik Diagramming Framework provides such a predefined shape. You can find a shape of type EllipseShape in the CommonShape extension class.
Example 6: Declaring EllipseShape in XAML
<telerik:RadDiagram>
    <telerik:RadDiagramShape x:Name="EndShape"
                             Width="50"
                             Height="50"
                             Content="End"
                             FontWeight="Bold"
                             Geometry="{telerik:CommonShape ShapeType=EllipseShape}" />
</telerik:RadDiagram>
Figure 8: Customized EllipseShape look

The RadDiagramItem class exposes ContentTemplate and ContentTemplateSelector properties that allow you to customize the content of the RadDiagramShapes and RadDiagramConnections.
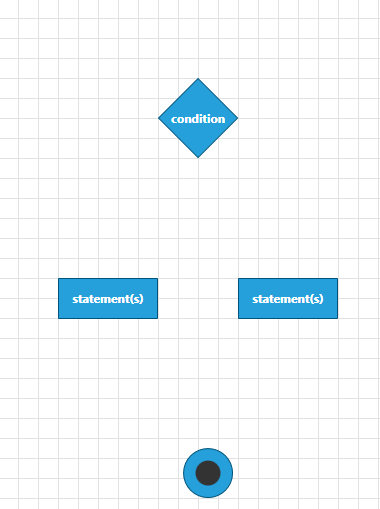
You can customize the content of the ellipse RadDiagramShape to mark it as the end of the "if-else" flow diagram.
Example 7: Customize EllipseShape in XAML
<telerik:RadDiagram>
    <telerik:RadDiagramShape x:Name="ConditionShape"
                             Width="80"
                             Height="80"
                             Content="condition"
                             FontWeight="Bold"
                             Geometry="{telerik:FlowChartShape ShapeType=DecisionShape}"
                             Position="160,80" />
    <telerik:RadDiagramShape x:Name="StatementShape1"
                             Width="100"
                             Content="statement(s)"
                             FontWeight="Bold"
                             Position="60,280" />
    <telerik:RadDiagramShape x:Name="StatementShape2"
                             Width="100"
                             Content="statement(s)"
                             FontWeight="Bold"
                             Position="240,280" />
    <telerik:RadDiagramShape x:Name="EndShape"
                             Width="50"
                             Height="50"
                             FontWeight="Bold"
                             Geometry="{telerik:CommonShape ShapeType=EllipseShape}"
                             Position="185,450">
        <telerik:RadDiagramShape.ContentTemplate>
            <DataTemplate>
                <Ellipse Width="25"
                         Height="25"
                         Fill="#FF333333" />
            </DataTemplate>
        </telerik:RadDiagramShape.ContentTemplate>
    </telerik:RadDiagramShape>
</telerik:RadDiagram>
Figure 9: Customized EllipseShape
Adding RadDiagramConnections
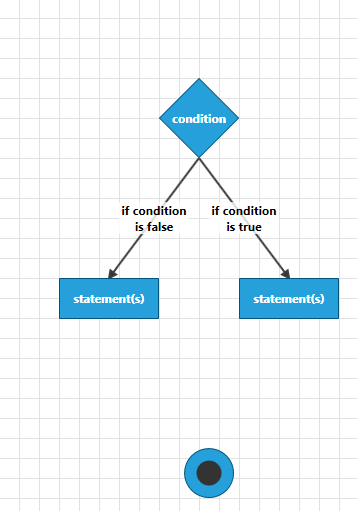
Finally, you can connect all shapes using RadDiagramConnections.
The RadDiagramConnection class exposes a set of properties that allow you to define and customize the source and target of the connection. For more information, please refer to the DiagramConnection tutorial.
In order to connect the shapes and finish the flow diagram of the "if-else" operator, you need to set up 5 connections:
-
Add connections between the 'condition' shape and the 'statements' shapes:
Example 8: Adding RadDiagramConnection in XAML
    <telerik:RadDiagramConnection Content="if condition is false"
                                  FontWeight="Bold"
                                  Source="{Binding ElementName=ConditionShape}"
                                  SourceConnectorPosition="Bottom"
                                  StrokeThickness="2"
                                  Target="{Binding ElementName=StatementShape1}"
                                  TargetCapType="Arrow1Filled">
        <telerik:RadDiagramConnection.ContentTemplate>
            <DataTemplate>
                <TextBlock Width="70"
                           TextAlignment="Center"
                           Text="{Binding}"
                           TextWrapping="Wrap" />
            </DataTemplate>
        </telerik:RadDiagramConnection.ContentTemplate>
    </telerik:RadDiagramConnection>
    <telerik:RadDiagramConnection Content="if condition is true"
                                  FontWeight="Bold"
                                  Source="{Binding ElementName=ConditionShape}"
                                  SourceConnectorPosition="Bottom"
                                  StrokeThickness="2"
                                  Target="{Binding ElementName=StatementShape2}"
                                  TargetCapType="Arrow1Filled">
        <telerik:RadDiagramConnection.ContentTemplate>
            <DataTemplate>
                <TextBlock Width="70"
                           TextAlignment="Center"
                           Text="{Binding}"
                           TextWrapping="Wrap" />
            </DataTemplate>
        </telerik:RadDiagramConnection.ContentTemplate>
    </telerik:RadDiagramConnection>
Figure 10: RadDiagramConnection visual example
-
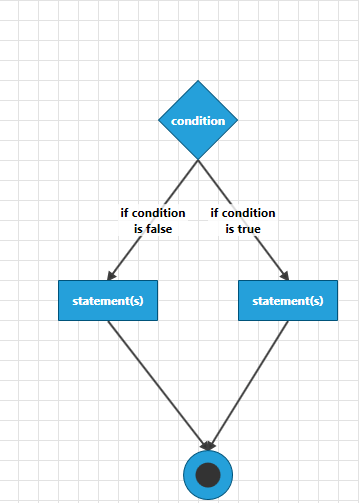
Add connections between the 'statements' shape and the 'final result' shapes:
Example 9: Add connection between shapes
    <telerik:RadDiagramConnection Source="{Binding ElementName=StatementShape1}"
                                  SourceConnectorPosition="Bottom"
                                  StrokeThickness="2"
                                  Target="{Binding ElementName=EndShape}"
                                  TargetCapType="Arrow1Filled" />
    <telerik:RadDiagramConnection Source="{Binding ElementName=StatementShape2}"
                                  SourceConnectorPosition="Bottom"
                                  StrokeThickness="2"
                                  Target="{Binding ElementName=EndShape}"
                                  TargetCapType="Arrow1Filled" />
Figure 11: RadDiagramConnection visual example
-
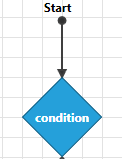
Add the connection that points to the start of the operator:
Example 10: Setting custom DataTemplate to RadDiagramConnection
    <telerik:RadDiagramConnection HorizontalContentAlignment="Center"
                                  VerticalContentAlignment="Top"
                                  Content="Start"
                                  FontWeight="Bold"
                                  SourceCapType="Arrow6Filled"
                                  StrokeThickness="2"
                                  Target="{Binding ElementName=ConditionShape}"
                                  TargetCapType="Arrow1Filled"
                                  StartPoint="200,20">
        <telerik:RadDiagramConnection.ContentTemplate>
            <DataTemplate>
                <TextBlock Margin="-18"
                           Text="{Binding}" />
            </DataTemplate>
        </telerik:RadDiagramConnection.ContentTemplate>
    </telerik:RadDiagramConnection>
Figure 12: Customized RadDiagramConnection
RadDiagram Example - "if-else" Operator Flow Diagram
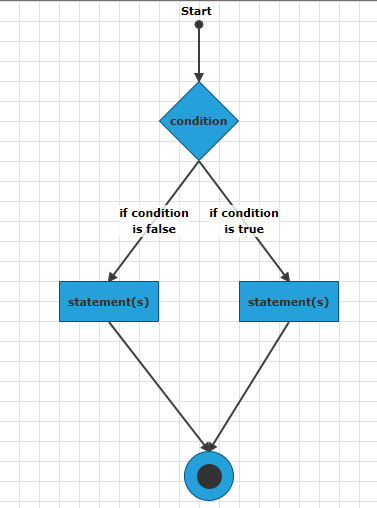
You can find the final XAML definition of the "if-else" flow diagram in Example 11.
Example 11: Final "if-else" flow diagram XAML
<telerik:RadDiagram>
    <telerik:RadDiagramShape x:Name="ConditionShape"
                             Width="80"
                             Height="80"
                             Content="condition"
                             FontWeight="Bold"
                             Geometry="{telerik:FlowChartShape ShapeType=DecisionShape}"
                             Position="160,80" />
    <telerik:RadDiagramConnection HorizontalContentAlignment="Center"
                                  VerticalContentAlignment="Top"
                                  Content="Start"
                                  FontWeight="Bold"
                                  SourceCapType="Arrow6Filled"
                                  StrokeThickness="2"
                                  Target="{Binding ElementName=ConditionShape}"
                                  TargetCapType="Arrow1Filled"
                                  StartPoint="200,20">
        <telerik:RadDiagramConnection.ContentTemplate>
            <DataTemplate>
                <TextBlock Margin="-18" Text="{Binding}" />
            </DataTemplate>
        </telerik:RadDiagramConnection.ContentTemplate>
    </telerik:RadDiagramConnection>
    <telerik:RadDiagramShape x:Name="StatementShape1"
                             Width="100"
                             Content="statement(s)"
                             FontWeight="Bold"
                             Position="60,280" />
    <telerik:RadDiagramConnection Content="if condition is false"
                                  FontWeight="Bold"
                                  Source="{Binding ElementName=ConditionShape}"
                                  SourceConnectorPosition="Bottom"
                                  StrokeThickness="2"
                                  Target="{Binding ElementName=StatementShape1}"
                                  TargetCapType="Arrow1Filled">
        <telerik:RadDiagramConnection.ContentTemplate>
            <DataTemplate>
                <TextBlock Width="70"
                           Text="{Binding}"
                           TextAlignment="Center"
                           TextWrapping="Wrap" />
            </DataTemplate>
        </telerik:RadDiagramConnection.ContentTemplate>
    </telerik:RadDiagramConnection>
    <telerik:RadDiagramShape x:Name="StatementShape2"
                             Width="100"
                             Content="statement(s)"
                             FontWeight="Bold"
                             Position="240,280" />
    <telerik:RadDiagramConnection Content="if condition is true"
                                  FontWeight="Bold"
                                  Source="{Binding ElementName=ConditionShape}"
                                  SourceConnectorPosition="Bottom"
                                  StrokeThickness="2"
                                  Target="{Binding ElementName=StatementShape2}"
                                  TargetCapType="Arrow1Filled">
        <telerik:RadDiagramConnection.ContentTemplate>
            <DataTemplate>
                <TextBlock Width="70"
                           Text="{Binding}"
                           TextAlignment="Center"
                           TextWrapping="Wrap" />
            </DataTemplate>
        </telerik:RadDiagramConnection.ContentTemplate>
    </telerik:RadDiagramConnection>
    <telerik:RadDiagramShape x:Name="EndShape"
                             Width="50"
                             Height="50"
                             FontWeight="Bold"
                             Geometry="{telerik:CommonShape ShapeType=EllipseShape}"
                             Position="185,450">
        <telerik:RadDiagramShape.ContentTemplate>
            <DataTemplate>
                <Ellipse Width="25"
                         Height="25"
                         Fill="#FF333333" />
            </DataTemplate>
        </telerik:RadDiagramShape.ContentTemplate>
    </telerik:RadDiagramShape>
    <telerik:RadDiagramConnection Source="{Binding ElementName=StatementShape1}"
                                  SourceConnectorPosition="Bottom"
                                  StrokeThickness="2"
                                  Target="{Binding ElementName=EndShape}"
                                  TargetCapType="Arrow1Filled" />
    <telerik:RadDiagramConnection Source="{Binding ElementName=StatementShape2}"
                                  SourceConnectorPosition="Bottom"
                                  StrokeThickness="2"
                                  Target="{Binding ElementName=EndShape}"
                                  TargetCapType="Arrow1Filled" />
</telerik:RadDiagram>
Figure 13: "if-else" operator flow diagram visual look
Setting a Theme
The controls from our suite support different themes. You can see how to apply a theme different than the default one in the Setting a Theme help article.
Changing the theme using implicit styles will affect all controls that have styles defined in the merged resource dictionaries. This is applicable only for the controls in the scope in which the resources are merged.
To change the theme, you can follow the steps below:
Choose between the themes and add reference to the corresponding theme assembly (ex: Telerik.Windows.Themes.Windows8.dll). You can see the different themes applied in the Theming examples from our WPF Controls Examples application.
-
Merge the ResourceDictionaries with the namespace required for the controls that you are using from the theme assembly. For the RadDiagram, you will need to merge the following resources:
- Telerik.Windows.Controls
- Telerik.Windows.Controls.Diagrams
- Telerik.Windows.Controls.Diagrams.Extensions
- Telerik.Windows.Controls.Input
- Telerik.Windows.Controls.Navigation
Example 12 demonstrates how to merge the ResourceDictionaries so that they are applied globally for the entire application.
Example 12: Merge the ResourceDictionaries
<Application.Resources>
    <ResourceDictionary>
        <ResourceDictionary.MergedDictionaries>
            <ResourceDictionary Source="/Telerik.Windows.Themes.Windows8;component/Themes/System.Windows.xaml"/>
            <ResourceDictionary Source="/Telerik.Windows.Themes.Windows8;component/Themes/Telerik.Windows.Controls.xaml"/>
            <ResourceDictionary Source="/Telerik.Windows.Themes.Windows8;component/Themes/Telerik.Windows.Controls.Navigation.xaml"/>
            <ResourceDictionary Source="/Telerik.Windows.Themes.Windows8;component/Themes/Telerik.Windows.Controls.Input.xaml"/>
            <ResourceDictionary Source="/Telerik.Windows.Themes.Windows8;component/Themes/Telerik.Windows.Controls.Diagrams.xaml"/>
            <ResourceDictionary Source="/Telerik.Windows.Themes.Windows8;component/Themes/Telerik.Windows.Controls.Diagrams.Extensions.xaml"/>
        </ResourceDictionary.MergedDictionaries>
    </ResourceDictionary>
</Application.Resources>
Alternatively, you can use the theme of the control via the StyleManager.
Figure 14 shows a RadDiagram with the Windows8 theme applied.
Figure 14: RadDiagram with the Windows8 theme
Telerik UI for WPF Learning Resources
- Telerik UI for WPF Diagrams Component
- Getting Started with Telerik UI for WPF Components
- Telerik UI for WPF Installation
- Telerik UI for WPF and WinForms Integration
- Telerik UI for WPF Visual Studio Templates
- Setting a Theme with Telerik UI for WPF
- Telerik UI for WPF Virtual Classroom (Training Courses for Registered Users)
- Telerik UI for WPF License Agreement