Dynamic Number of Series (ChartSeriesProvider)
In this help topic, we describe the mechanism for an automatic series generation that ChartView3D provides.
RadCartesianChart3D can create a dynamic number of series that depend on the data (collection of collections). To take advantage of this feature, you can create a ChartSeriesProvider3D object. This object receives the data and holds the ChartSeriesDescriptor3D objects that define the specific properties of the dynamically generated series.
The series provider expects a collection of models that describe each chart series. The series models should expose a collection of models describing each data point. The XyzSeries3DDescriptor implementation allows you to easily define the path to the items source and X, Y, Z properties of the models.
To provide the data collection to the ChartSeriesProvider3D, set its Source property.
The XyzSeries3DDescriptor exposes the following properties that are used to link the series with the models:
ItemsSourcePath:stringproperty that sets the name of the collection property defined in the series business model.XValuePath:stringproperty that sets the name of the data point's X property defined in the data point business model.YValuePath:stringproperty that sets the name of the data point's Y property defined in the data point business model.ZValuePath:stringproperty that sets the name of the data point's Z property defined in the data point business model.
Setting those properties is enough to adjust the provider. This will auto-generate PointSeries3D instance for each item in the
Sourceof the series provider.
<telerik:RadCartesianChart3D Palette="Windows8">
    <telerik:RadCartesianChart3D.XAxis>
        <telerik:CategoricalAxis3D />
    </telerik:RadCartesianChart3D.XAxis>
    <telerik:RadCartesianChart3D.YAxis>
        <telerik:CategoricalAxis3D />
    </telerik:RadCartesianChart3D.YAxis>
    <telerik:RadCartesianChart3D.ZAxis>
        <telerik:LinearAxis3D />
    </telerik:RadCartesianChart3D.ZAxis>
    <telerik:RadCartesianChart3D.SeriesProvider>
        <telerik:ChartSeriesProvider3D Source="{Binding MySeriesViewModelsCollection}">
            <telerik:ChartSeriesProvider3D.SeriesDescriptors>
                <telerik:XyzSeries3DDescriptor ItemsSourcePath="Items"
                                               XValuePath="X"
                                               YValuePath="Y"
                                               ZValuePath="Z"/>
            </telerik:ChartSeriesProvider3D.SeriesDescriptors>
        </telerik:ChartSeriesProvider3D>
    </telerik:RadCartesianChart3D.SeriesProvider>
</telerik:RadCartesianChart3D>
Determine the Series Type
The default created series is a PointSeries3D. To change this, you can use one of the following approaches.
Using the Style property of the descriptor
The easiest way to determine the type of the series is to assign the Style property of the descriptor and set its TargetType.
<telerik:XyzSeries3DDescriptor XValuePath="X" YValuePath="Y" ZValuePath="Z" ItemsSourcePath="Items">
    <telerik:XyzSeries3DDescriptor.Style>
        <Style TargetType="telerik:BarSeries3D" />
    </telerik:XyzSeries3DDescriptor.Style>
</telerik:XyzSeries3DDescriptor>
If you use NoXaml dlls and the implicit styles theming mechanism, you must base the Style of the descriptor on the default style of the series. The setting should like something like this:
<Style TargetType="telerik:BarSeries3D" BasedOn="{StaticResource BarSeries3DStyle}">. The same naming convention is us applicable for all other chart series - SurfaceSeries3DStyle, PointSeries3DStyle and LineSeries3DStyle. If you don't set the BasedOn attribute when using NoXaml dlls, the series won't display any data points.
The Style property can be used also to customize the appearance of the series by setting its properties.
Using the TypePath property of the descriptor
The TypePath allows you to define a chart series type that will be used when creating a chart series instance for each item in the Source collection. In this case, you can have multiple series with different types. The property accepts a value of type string that points to the name of a property in the series business model. The property can be of any data type, but the most common scenarios are - Type and string.
If you provide a Type value to the TypePath, the ChartSeriesDescriptor3D will be able to automatically determine the type of the series that should be created.
public class SeriesViewModel3D
{
    public Type SeriesType { get; set; } // this can be typeof(PointSeries3D), typeof(BarSeries3D), etc.).
    //other properties here
}
<telerik:XyzSeries3DDescriptor XValuePath="X" YValuePath="Y" ZValuePath="Z" ItemsSourcePath="Items" TypePath="SeriesType"/>
string or any other object to the TypePath, you will need to set also the TypeConverter property. It allows you to implement an IValueConverter that gets the value from the TypePath property and converts it to a Type, which is later used to create the chart series.
public class SeriesViewModel3D
{
    public string SeriesType { get; set; } // this can contain any value, but for this example, lets say you have values like "Bar", "Point", etc.
    //other properties here
}
<telerik:XyzSeries3DDescriptor XValuePath="X" YValuePath="Y" ZValuePath="Z" ItemsSourcePath="Items" TypePath="SeriesType">
<telerik:XyzSeries3DDescriptor.TypeConverter>
        <local:SeriesTypeConverter />
    </telerik:XyzSeries3DDescriptor.TypeConverter>
</telerik:XyzSeries3DDescriptor>
public class SeriesTypeConverter : IValueConverter
{
    public object Convert(object value, Type targetType, object parameter, CultureInfo culture)
    {
        string seriesType = (string)value;
        if (seriesType == "Point")
        {
            return typeof(PointSeries3D);
        }
        else
        {
            return typeof(BarSeries3D);
        }
    }

    public object ConvertBack(object value, Type targetType, object parameter, CultureInfo culture)
    {
        throw new NotImplementedException();
    }
}
TypeConverter will be invoked even if you don't set the TypePath property. In this case, the value in the Convert method of the converter will be the view model of the series.
Sampling Support
To use the sampling support with the series provider feature, you can set the ChartDataSourceStyle property of the ChartSeriesDescriptor3D.
<telerik:XyzSeries3DDescriptor XValuePath="X" YValuePath="Y" ZValuePath="Z" ItemsSourcePath="Items" >
    <telerik:XyzSeries3DDescriptor.ChartDataSourceStyle>
        <Style TargetType="telerik:ChartDataSource">
            <Setter Property="SamplingThreshold" Value="5" />
        </Style>
    </telerik:XyzSeries3DDescriptor.ChartDataSourceStyle>
</telerik:XyzSeries3DDescriptor>
Assigning Descriptor to Item from the Source
By default all descriptors in the series provider will use all the items in the data source. However, you can assign a descriptor to be applied only to a specific item from the data source (the Source property). To do so, set the CollectionIndex property of the XyzSeries3DDescriptor. For example, setting the property to 1 will use the descriptor only for the second item in the Source collection. This property is useful when, lets say, a BarSeries3D needs to be generated for the first data entry and PointSeries3D for the rest of the entries.
<telerik:RadCartesianChart3D Palette="Windows8">
        <telerik:RadCartesianChart3D.XAxis>
            <telerik:CategoricalAxis3D />
        </telerik:RadCartesianChart3D.XAxis>
        <telerik:RadCartesianChart3D.YAxis>
            <telerik:CategoricalAxis3D />
        </telerik:RadCartesianChart3D.YAxis>
        <telerik:RadCartesianChart3D.ZAxis>
            <telerik:LinearAxis3D />
        </telerik:RadCartesianChart3D.ZAxis>
        <telerik:RadCartesianChart3D.SeriesProvider>
            <telerik:ChartSeriesProvider3D Source="{Binding MySeriesViewModelsCollection}">
                <telerik:ChartSeriesProvider3D.SeriesDescriptors>
                    <telerik:XyzSeries3DDescriptor XValuePath="X" YValuePath="Y" ZValuePath="Z" ItemsSourcePath="Items" CollectionIndex="0">
                        <telerik:XyzSeries3DDescriptor.Style>
                            <Style TargetType="telerik:BarSeries3D" />
                        </telerik:XyzSeries3DDescriptor.Style>
                    </telerik:XyzSeries3DDescriptor>
                    <telerik:XyzSeries3DDescriptor XValuePath="X" YValuePath="Y" ZValuePath="Z" ItemsSourcePath="Items">
                        <telerik:XyzSeries3DDescriptor.Style>
                            <Style TargetType="telerik:PointSeries3D">
                                <Setter Property="PointSize" Value="100 100 100" />
                            </Style>
                        </telerik:XyzSeries3DDescriptor.Style>
                    </telerik:XyzSeries3DDescriptor>
                </telerik:ChartSeriesProvider3D.SeriesDescriptors>
            </telerik:ChartSeriesProvider3D>
        </telerik:RadCartesianChart3D.SeriesProvider>
    </telerik:RadCartesianChart3D>
Events
ChartSeriesProvider3D expose a single event - SeriesCreated. The event occurs when a series is created. It allows for the series to be additionally set up or completely replaced.
The event arguments are of type ChartSeries3DCreatedEventArgs and expose the following properties:
-
Series: A property of typeCartesianSeries3Dthat holds the created series. -
Context: A property of typeobjectthat holds the model of the series.
This event may be raised with the series being null (for example, in cases when a suitable descriptor was not found). In such a case, this event can still be used to create and set up a new series.
<telerik:ChartSeriesProvider3D SeriesCreated="ChartSeriesProvider3D_SeriesCreated"/>
private void ChartSeriesProvider3D_SeriesCreated(object sender, Telerik.Windows.Controls.ChartView.ChartSeries3DCreatedEventArgs e)
{
    if (e.Series is PointSeries3D)
    {
        PointSeries3D pointSeries = ((PointSeries3D)e.Series);
        pointSeries.DefaultVisualMaterial = new DiffuseMaterial(Brushes.Purple);
    }
}
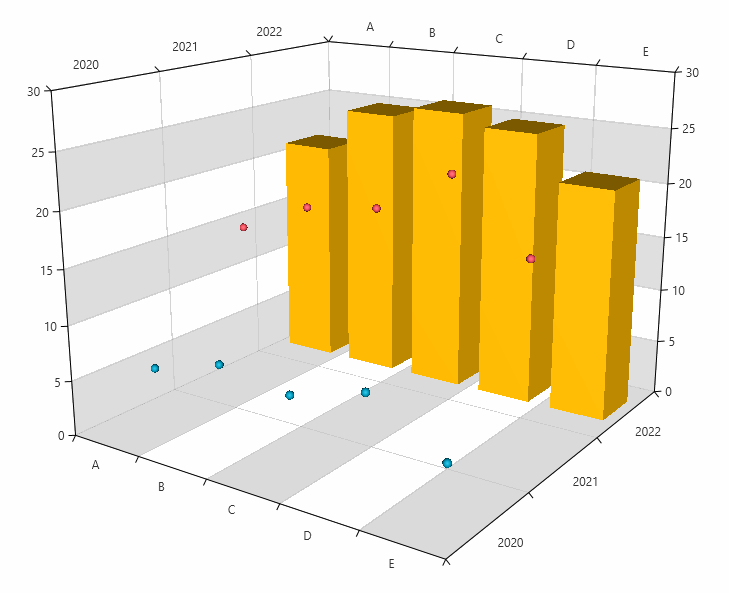
Code Example
In the following example, the chart is populated by a collection of 3 items, thus creating 3 series. There is a XyzSeries3DDescriptor with CollectionIndex set to 2 and a style with TargetType set to PointSeries3D. This means that there will be a BarSeries3D, created for the third item in the Source collection. There is another XyzSeries3DDescriptor, which is responsible for creating PointSeries3D for the rest of the items in the source collection.
<telerik:RadCartesianChart3D Palette="Fluent">
    <telerik:RadCartesianChart3D.XAxis>
        <telerik:CategoricalAxis3D />
    </telerik:RadCartesianChart3D.XAxis>
    <telerik:RadCartesianChart3D.YAxis>
        <telerik:CategoricalAxis3D />
    </telerik:RadCartesianChart3D.YAxis>
    <telerik:RadCartesianChart3D.ZAxis>
        <telerik:LinearAxis3D />
    </telerik:RadCartesianChart3D.ZAxis>
    <telerik:RadCartesianChart3D.Behaviors>
        <telerik:Chart3DCameraBehavior />
    </telerik:RadCartesianChart3D.Behaviors>
       <telerik:RadCartesianChart3D.Grid>
            <telerik:CartesianChart3DGrid YZStripLinesVisibility="Z"
                                          XZStripLinesVisibility="Z"
                                          XYStripLinesVisibility="X"/>
        </telerik:RadCartesianChart3D.Grid>
    <telerik:RadCartesianChart3D.SeriesProvider>
        <telerik:ChartSeriesProvider3D Source="{Binding Data}">
            <telerik:ChartSeriesProvider3D.SeriesDescriptors>
                <telerik:XyzSeries3DDescriptor XValuePath="X" YValuePath="Y" ZValuePath="Z" ItemsSourcePath="Items"/>

                <telerik:XyzSeries3DDescriptor XValuePath="X"
                                               YValuePath="Y"
                                               ZValuePath="Z"
                                               ItemsSourcePath="Items"
                                               CollectionIndex="2">
                    <telerik:XyzSeries3DDescriptor.Style>
                        <Style TargetType="telerik:BarSeries3D" />
                    </telerik:XyzSeries3DDescriptor.Style>
                </telerik:XyzSeries3DDescriptor>
            </telerik:ChartSeriesProvider3D.SeriesDescriptors>
        </telerik:ChartSeriesProvider3D>
    </telerik:RadCartesianChart3D.SeriesProvider>
</telerik:RadCartesianChart3D>
public class PlotInfo3D
{
    public object X { get; set; }
    public object Y { get; set; }
    public double Z { get; set; }
}

public class SeriesViewModel3D
{
    public string SeriesType { get; set; }

    public ObservableCollection<PlotInfo3D> Items { get; set; }
}

public class MainViewModel
{
    public ObservableCollection<SeriesViewModel3D> Data { get; set; }

    public MainViewModel()
    {
        this.Data = new ObservableCollection<SeriesViewModel3D>()
        {
            new SeriesViewModel3D()
            {
                SeriesType = "Bar",
                Items = new ObservableCollection<PlotInfo3D>()
                {
                    new PlotInfo3D() { X = "A", Y = 2020, Z = 5},
                    new PlotInfo3D() { X = "B", Y = 2020, Z = 7},
                    new PlotInfo3D() { X = "C", Y = 2020, Z = 6},
                    new PlotInfo3D() { X = "D", Y = 2020, Z = 8},
                    new PlotInfo3D() { X = "E", Y = 2020, Z = 4}
                }
            },
            new SeriesViewModel3D()
            {
                SeriesType = "Bar",
                Items = new ObservableCollection<PlotInfo3D>()
                {
                    new PlotInfo3D() { X = "A", Y = 2021, Z = 15},
                    new PlotInfo3D() { X = "B", Y = 2021, Z = 18},
                    new PlotInfo3D() { X = "C", Y = 2021, Z = 19},
                    new PlotInfo3D() { X = "D", Y = 2021, Z = 23},
                    new PlotInfo3D() { X = "E", Y = 2021, Z = 17}
                }
            },
            new SeriesViewModel3D()
            {
                SeriesType = "Point",
                Items = new ObservableCollection<PlotInfo3D>()
                {
                    new PlotInfo3D() { X = "A", Y = 2022, Z = 21},
                    new PlotInfo3D() { X = "B", Y = 2022, Z = 25},
                    new PlotInfo3D() { X = "C", Y = 2022, Z = 26},
                    new PlotInfo3D() { X = "D", Y = 2022, Z = 25},
                    new PlotInfo3D() { X = "E", Y = 2022, Z = 21}
                }
            }
        };
    }
}