WeightedMovingAverageIndicator
WeightedMovingAverageIndicator measures and shows the simple average for a period of past data using heavier weighting, thus smoothing the data to form a trend following.
To set up the indicator you can set its CategoryBinding, ValueBinding and ItemsSource properties. Additionally, you can control the period (in days) over which the indicator will be applied. To do this set the Period property.
Example 1: WeightedMovingAverageIndicator
 <telerik:RadCartesianChart.Indicators>
    <telerik:WeightedMovingAverageIndicator Period="5"
                                            CategoryBinding="Date"
                                            ValueBinding="Close"
                                            ItemsSource="{Binding Data}"/>
</telerik:RadCartesianChart.Indicators>
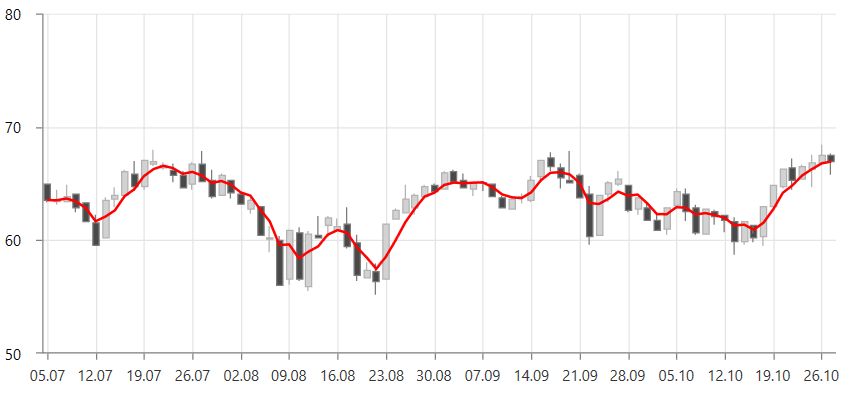
Figure 1: WeightedMovingAverageIndicator
The indicator can be set up the same way as a normal chart series. This is why you can populate it using the same approach as shown in the Data Bind to Data-Object article. You can set the corresponding value binding properties - for example, ValueBinding, CategoryBinding, HighBinding, CloseBinding, etc, and also the ItemsSource.