Creating a Chart With Custom Layout
If the default layout provided by the RadChart.DefaultView does not fit your scenario, then you can define your own layout where to put all the elements you need. Moreover - you can add as many ChartArea, ChartLegend and ChartTitle as you need.
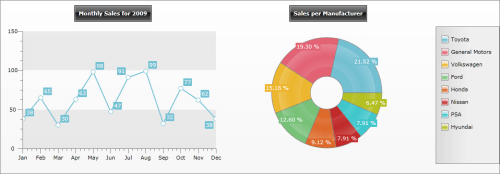
If, for example, you want to show the monthly sales of cars for the year 2009 on one chart and next to it, as a second chart to display the sales per car manufacturer with a legend, then you have to set UseDefaultLayout to False and to define your own. In this example, you have Grid with two rows and three columns. On the first row two ChartTitle elements are placed in the first and the second columns where the chart areas will be placed. On the second row will be added two ChartArea controls in the first two columns and a ChartLegend in the third column.
<telerik:RadChart UseDefaultLayout="False" Height="362" Width="1042" VerticalAlignment="Bottom">
    <Grid VerticalAlignment="Stretch" HorizontalAlignment="Stretch" Margin="10,10,0,20">
        <Grid.RowDefinitions>
            <RowDefinition Height="Auto" />
            <RowDefinition Height="" />
        </Grid.RowDefinitions>
        <Grid.ColumnDefinitions>
            <ColumnDefinition Width="" />
            <ColumnDefinition Width="*" />
            <ColumnDefinition Width="Auto" />
        </Grid.ColumnDefinitions>
        <telerik:ChartTitle Margin="0,0,0,10" HorizontalAlignment="Center" Content="Monthly Sales for 2009"
            Grid.Row="0" Grid.Column="0" />
        <telerik:ChartArea HorizontalAlignment="Stretch" VerticalAlignment="Stretch"
            Grid.Row="1" Grid.Column="0">
            <telerik:ChartArea.DataSeries>
                <!-- Line Chart -->
                <telerik:DataSeries>
                    <telerik:DataSeries.Definition>
                        <telerik:LineSeriesDefinition />
                    </telerik:DataSeries.Definition>
                    <telerik:DataPoint YValue="38" XCategory="Jan"/>
                    <telerik:DataPoint YValue="65" XCategory="Feb"/>
                    <telerik:DataPoint YValue="30" XCategory="Mar"/>
                    <telerik:DataPoint YValue="63" XCategory="Apr"/>
                    <telerik:DataPoint YValue="98" XCategory="May"/>
                    <telerik:DataPoint YValue="47" XCategory="Jun"/>
                    <telerik:DataPoint YValue="91" XCategory="Jul"/>
                    <telerik:DataPoint YValue="99" XCategory="Aug"/>
                    <telerik:DataPoint YValue="32" XCategory="Sep"/>
                    <telerik:DataPoint YValue="77" XCategory="Oct"/>
                    <telerik:DataPoint YValue="62" XCategory="Nov"/>
                    <telerik:DataPoint YValue="38" XCategory="Dec"/>
                </telerik:DataSeries>
            </telerik:ChartArea.DataSeries>
        </telerik:ChartArea>
        <telerik:ChartTitle HorizontalAlignment="Center" Content="Sales per Manufacturer"
            Margin="0,0,0,10" Grid.Row="0" Grid.Column="1" />
        <telerik:ChartArea LegendName="ChartLegendManufacturers" VerticalAlignment="Stretch" HorizontalAlignment="Stretch"
            Margin="0,0,0,15" Grid.Row="1" Grid.Column="1">
            <telerik:ChartArea.DataSeries>
                <!-- Doughnut Chart -->
                <telerik:DataSeries>
                    <telerik:DataSeries.Definition>
                        <telerik:DoughnutSeriesDefinition ItemLabelFormat="p">
                        </telerik:DoughnutSeriesDefinition>
                    </telerik:DataSeries.Definition>
                    <telerik:DataPoint YValue="0.215208267" LegendLabel="Toyota"/>
                    <telerik:DataPoint YValue="0.192960612" LegendLabel="General Motors"/>
                    <telerik:DataPoint YValue="0.151830229" LegendLabel="Volkswagen"/>
                    <telerik:DataPoint YValue="0.125964366" LegendLabel="Ford"/>
                    <telerik:DataPoint YValue="0.091152353" LegendLabel="Honda"/>
                    <telerik:DataPoint YValue="0.079093251" LegendLabel="Nissan"/>
                    <telerik:DataPoint YValue="0.079093251" LegendLabel="PSA"/>
                    <telerik:DataPoint YValue="0.06469767" LegendLabel="Hyundai"/>
                </telerik:DataSeries>
            </telerik:ChartArea.DataSeries>
        </telerik:ChartArea>
        <telerik:ChartLegend x:Name="ChartLegendManufacturers"
                             Header=""
                             VerticalAlignment="Stretch"
                             Grid.Row="1" Grid.Column="2" />
    </Grid>
</telerik:RadChart>
In the image bellow you can see how the custom layout chart looks like: