Annotations
Annotations are visual elements that can be used to highlight certain areas on the plot area and denote significant values. The currently supported annotations are Grid Line and Plot Band. This article shows examples for both.
Common properties to the all types of annotations are:
BorderDashStyle: Defines the dash style of the border of the annotation
BorderColor: Sets the color of the border of the annotation
BorderWidth: Specifies the width of the border of the annotation
Grid Line Annotation
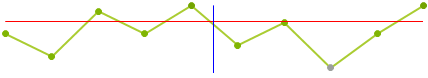
Grid line annotations are lines or circles that cross the chart grid at location on the axis, specified by their Value property.
Here is how the GridLine annotation looks like.
Figure 1: CartesianSparkGridLineAnnotation
The following example shows how you can create a Grid Line annotation.
Add Plot Band Annotation
public void AddGridLineAnnotation()
{
    CartesianSparkGridLineAnnotation annotation1 = new CartesianSparkGridLineAnnotation();
    annotation1.Axis = this.radSparkline1.Axes[1] as SparkCartesianAxis;
    annotation1.Value = 3;
    annotation1.BorderColor = Color.Red;
    annotation1.BorderDashStyle = DashStyle.Solid;
    annotation1.BorderWidth = 1;
    this.radSparkline1.Annotations.Add(annotation1);
    CartesianSparkGridLineAnnotation annotation2 = new CartesianSparkGridLineAnnotation();
    annotation2.Axis = this.radSparkline1.Axes[0] as SparkCartesianAxis;
    annotation2.Value = "Test";
    annotation2.BorderColor = Color.Blue;
    annotation2.BorderDashStyle = DashStyle.Solid;
    annotation2.BorderWidth = 1;
    this.radSparkline1.Annotations.Add(annotation2);
}
Public Sub AddGridLineAnnotation()
    Dim annotation1 As New CartesianSparkGridLineAnnotation()
    annotation1.Axis = TryCast(Me.radSparkline1.Axes(1), SparkCartesianAxis)
    annotation1.Value = 3
    annotation1.BorderColor = Color.Red
    annotation1.BorderDashStyle = DashStyle.Solid
    annotation1.BorderWidth = 1
    Me.radSparkline1.Annotations.Add(annotation1)
    Dim annotation2 As New CartesianSparkGridLineAnnotation()
    annotation2.Axis = TryCast(Me.radSparkline1.Axes(0), SparkCartesianAxis)
    annotation2.Value = "Test"
    annotation2.BorderColor = Color.Blue
    annotation2.BorderDashStyle = DashStyle.Solid
    annotation2.BorderWidth = 1
    Me.radSparkline1.Annotations.Add(annotation2)
End Sub
Properties specific to the Grid Line Annotations are:
Axis: The Cartesian grid line annotation needs to be associated with horizontal or vertical axis explicitly.
Value (of type object): The place on the associated axis where the annotation crosses it. When the associated axis is numerical (linear or logarithmic) a numeric value is expected and when it is a categorical - a category.
Label: This property allows you to display text near the annotation and indicate what it is for.
Plot Band Annotation
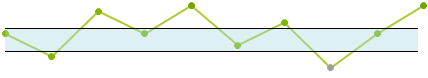
Cartesian plot band annotation is either a horizontal or a vertical stripe that crosses from start to end the vertical or the horizontal axis respectively.
Here is how the Plot Band annotation looks like.
Figure 2: CartesianSparkPlotBandAnnotation
The following example shows how you can create a Plot Band annotation.
Add Plot Band Annotation
public void AddPlotBandAnottation()
{
    CartesianSparkPlotBandAnnotation annotation1 = new CartesianSparkPlotBandAnnotation();
    annotation1.Axis = this.radSparkline1.Axes[1] as SparkCartesianAxis;
    annotation1.From = -2;
    annotation1.To = 2;
    annotation1.BackColor = Color.FromArgb(100, Color.LightBlue);
    annotation1.BorderColor = Color.Black;
    annotation1.BorderWidth = 1;
    this.radSparkline1.Annotations.Add(annotation1);
}
Public Sub AddPlotBandAnottation()
    Dim annotation1 As New CartesianSparkPlotBandAnnotation()
    annotation1.Axis = TryCast(Me.radSparkline1.Axes(1), SparkCartesianAxis)
    annotation1.From = -2
    annotation1.To = 2
    annotation1.BackColor = Color.FromArgb(100, Color.LightBlue)
    annotation1.BorderColor = Color.Black
    annotation1.BorderWidth = 1
    Me.radSparkline1.Annotations.Add(annotation1)
End Sub
Properties specific to the Plot Band Annotations are:
Axis: The Cartesian plotBand annotation needs to be associated with horizontal or vertical axis explicitly.
From (of type object): The starting point for the plot band. When the associated axis is numerical (Linear or Logarithmic) a numeric value is expected and when it is a CategoricalAxis - a category.
To (of type object): The ending point for the plot band. When the associated axis is numerical (Linear or Logarithmic) a numeric value is expected and when it is a CategoricalAxis - a category.
Label: This property allows you to display text near the annotation and indicate what it is for.