Unbound Mode
When in unbound mode, RadHeatMap does not use its DataSource to generate its content. In this article, we will cover the scenarios in which the control is populated programmatically in all available definitions.
Categorical Definition
In this example, we will showcase the usage of the CategoricalDefinition to illustrate how to add items programmatically. Start by creating an instance of this object and populate its Items collection property with CategoricalHeatMapItem items. These items represent the rows, columns, and values of each category in your data. For instance, you can pass the desired data to the constructor parameters of each CategoricalHeatMapItem. If you wish to apply a custom colorizer, you can assign your own instance of the HeatMapGradientColorizer to the Colorizer property of the CategoricalDefinition. This allows you to customize the color scheme according to your preferences.
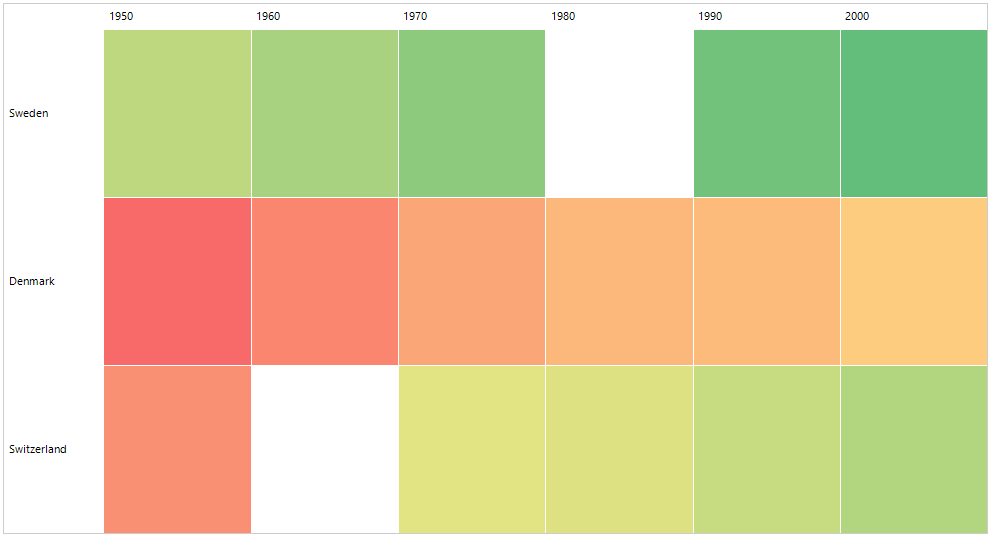
RadHeatMap supports Empty Values. In situations where you don't have a specific value for a particular category, you can indicate it by using the special object double.NaN. When a category is marked with double.NaN, the RadHeatMap control will visualize it with no color. This visual representation helps to indicate the absence of a value for that specific category. Thus, when using a dark theme, the empty cells remain dark, when using light themes, the empty cells remain light.
Example 1: Categorical Definition
CategoricalDefinition def = new CategoricalDefinition();
HeatMapGradientColorizer colorizer = new HeatMapGradientColorizer();
colorizer.GradientStops.Add(new GradientStop(ColorTranslator.FromHtml("#FFF8696B"), 0.0f));
colorizer.GradientStops.Add(new GradientStop(ColorTranslator.FromHtml("#FFFFEB84"), 0.3f));
colorizer.GradientStops.Add(new GradientStop(ColorTranslator.FromHtml("#FF63BE7B"), 1.0f));
def.Colorizer = colorizer;
def.Items.Add(new CategoricalHeatMapItem("Sweden", 1950, 7015));
def.Items.Add(new CategoricalHeatMapItem("Sweden", 1960, 7481));
def.Items.Add(new CategoricalHeatMapItem("Sweden", 1970, 8043));
def.Items.Add(new CategoricalHeatMapItem("Sweden", 1980, double.NaN));
def.Items.Add(new CategoricalHeatMapItem("Sweden", 1990, 8601));
def.Items.Add(new CategoricalHeatMapItem("Sweden", 2000, 8925));
def.Items.Add(new CategoricalHeatMapItem("Denmark", 1950, 4272));
def.Items.Add(new CategoricalHeatMapItem("Denmark", 1960, 4582));
def.Items.Add(new CategoricalHeatMapItem("Denmark", 1970, 4929));
def.Items.Add(new CategoricalHeatMapItem("Denmark", 1980, 5124));
def.Items.Add(new CategoricalHeatMapItem("Denmark", 1990, 5141));
def.Items.Add(new CategoricalHeatMapItem("Denmark", 2000, 5338));
def.Items.Add(new CategoricalHeatMapItem("Switzerland", 1950, 4695));
def.Items.Add(new CategoricalHeatMapItem("Switzerland", 1960, double.NaN));
def.Items.Add(new CategoricalHeatMapItem("Switzerland", 1970, 6268));
def.Items.Add(new CategoricalHeatMapItem("Switzerland", 1980, 6386));
def.Items.Add(new CategoricalHeatMapItem("Switzerland", 1990, 6844));
def.Items.Add(new CategoricalHeatMapItem("Switzerland", 2000, 7278));
this.radHeatMap1.RowHeaderWidth = 100;
this.radHeatMap1.Definition = def;
Dim def As CategoricalDefinition = New CategoricalDefinition()
Dim colorizer As HeatMapGradientColorizer = New HeatMapGradientColorizer()
colorizer.GradientStops.Add(New GradientStop(ColorTranslator.FromHtml("#FFF8696B"), 0.0F))
colorizer.GradientStops.Add(New GradientStop(ColorTranslator.FromHtml("#FFFFEB84"), 0.3F))
colorizer.GradientStops.Add(New GradientStop(ColorTranslator.FromHtml("#FF63BE7B"), 1.0F))
def.Colorizer = colorizer
def.Items.Add(New CategoricalHeatMapItem("Sweden", 1950, 7015))
def.Items.Add(New CategoricalHeatMapItem("Sweden", 1960, 7481))
def.Items.Add(New CategoricalHeatMapItem("Sweden", 1970, 8043))
def.Items.Add(New CategoricalHeatMapItem("Sweden", 1980, Double.NaN))
def.Items.Add(New CategoricalHeatMapItem("Sweden", 1990, 8601))
def.Items.Add(New CategoricalHeatMapItem("Sweden", 2000, 8925))
def.Items.Add(New CategoricalHeatMapItem("Denmark", 1950, 4272))
def.Items.Add(New CategoricalHeatMapItem("Denmark", 1960, 4582))
def.Items.Add(New CategoricalHeatMapItem("Denmark", 1970, 4929))
def.Items.Add(New CategoricalHeatMapItem("Denmark", 1980, 5124))
def.Items.Add(New CategoricalHeatMapItem("Denmark", 1990, 5141))
def.Items.Add(New CategoricalHeatMapItem("Denmark", 2000, 5338))
def.Items.Add(New CategoricalHeatMapItem("Switzerland", 1950, 4695))
def.Items.Add(New CategoricalHeatMapItem("Switzerland", 1960, Double.NaN))
def.Items.Add(New CategoricalHeatMapItem("Switzerland", 1970, 6268))
def.Items.Add(New CategoricalHeatMapItem("Switzerland", 1980, 6386))
def.Items.Add(New CategoricalHeatMapItem("Switzerland", 1990, 6844))
def.Items.Add(New CategoricalHeatMapItem("Switzerland", 2000, 7278))
Me.radHeatMap1.RowHeaderWidth = 100
Me.radHeatMap1.Definition = def
Horizontal / Vertical Definition
The heatmap can be displayed either horizontally or vertically, depending on the chosen definition. Each column or row is represented by a MemberMapping, which defines how the data will be displayed and colored. The colorization scheme is specified in the MemberMappings associated with the corresponding definition.
To populate the heatmap with data, we add HeatMapItem objects to the "Items" collection of the horizontal or vertical definition. Each HeatMapItem represents a row or column and includes the necessary information, such as the header and an array of values.
The only difference between the Horizontal and Vertical definitions is that for the horizontal definition, each item gets a row, while for the vertical – it's a column.
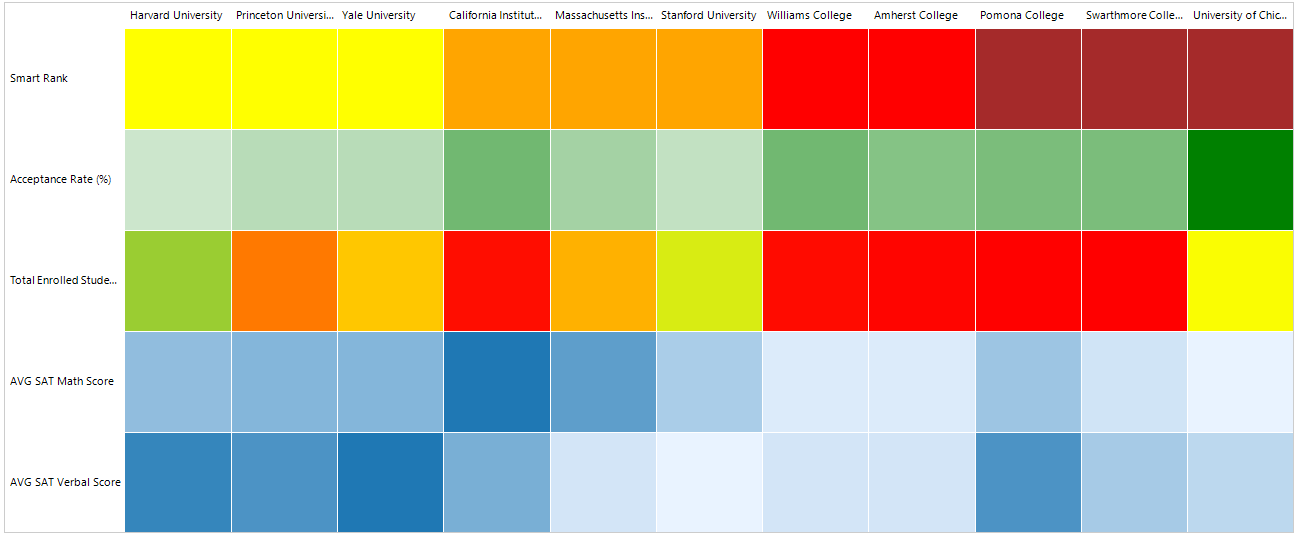
Example 2: Horizontal Definition
Color PoorColor = ColorTranslator.FromHtml("#FFE9F3FF");
Color GoodColor = ColorTranslator.FromHtml("#FF1F78B4");

HeatMapRangeColorizer SmartRankColorizer = new HeatMapRangeColorizer()
{
    IsAbsolute = false,
    Colors = new HeatMapRangeColorCollection()
    {
        new HeatMapRangeColor() {From = 0, To = 0.25, Color = Color.Yellow},
        new HeatMapRangeColor() {From = 0.25, To = 0.5, Color = Color.Orange},
        new HeatMapRangeColor() {From = 0.5, To = 0.75, Color = Color.Red},
        new HeatMapRangeColor() {From = 0.75, To = 1, Color = Color.Brown},
    }
};

HeatMapDesaturationColorizer AcceptanceRateColorizer = new HeatMapDesaturationColorizer()
{
    StartColor = Color.Green,
    From = 1,
    To = 0.2
};

HeatMapGradientColorizer EnrolledStudentsColorizer = new HeatMapGradientColorizer();
EnrolledStudentsColorizer.GradientStops = new List<GradientStop>()
{
    new GradientStop() { Position = 0f, Color = Color.Red },
    new GradientStop() { Position = 0.5f, Color = Color.Yellow },
    new GradientStop() { Position = 1f, Color = Color.YellowGreen },
};

HeatMapGradientColorizer SATMathScoreColorizer = new HeatMapGradientColorizer();
SATMathScoreColorizer.GradientStops = new List<GradientStop>()
{
    new GradientStop() { Position = 0f, Color = PoorColor},
    new GradientStop() { Position = 1f, Color = GoodColor},
};

HeatMapGradientColorizer SATVerbalScoreColorizer = new HeatMapGradientColorizer();
SATVerbalScoreColorizer.GradientStops = new List<GradientStop>()
{
    new GradientStop(){ Position = 0f, Color = PoorColor},
    new GradientStop(){ Position = 1f, Color = GoodColor},
};

HeatMapGradientColorizer SATCompositeScoreColorizer = new HeatMapGradientColorizer();
SATCompositeScoreColorizer.GradientStops = new List<GradientStop>()
{
    new GradientStop(){ Position = 0f, Color = PoorColor},
    new GradientStop(){ Position = 1f, Color = GoodColor},
};

VerticalDefinition deff = new VerticalDefinition();

deff.MemberMappings = new MemberMappingsCollection()
{
    new MemberMapping() { Header = "Smart Rank", ValueMember = "SmartRank", Colorizer = SmartRankColorizer },
    new MemberMapping() { Header = "Acceptance Rate (%)", ValueMember = "AcceptanceRate", Colorizer = AcceptanceRateColorizer } ,
    new MemberMapping() { Header = "Total Enrolled Students", ValueMember = "TotalEnrolledStudents", Colorizer = EnrolledStudentsColorizer },
    new MemberMapping() { Header = "AVG SAT Math Score", ValueMember = "AverageSATMathScore", Colorizer = SATMathScoreColorizer },
    new MemberMapping() { Header = "AVG SAT Verbal Score", ValueMember = "AverageSATVerbalScore", Colorizer = SATVerbalScoreColorizer }
};

deff.Items.Add(new HeatMapItem("Harvard University", 1, 8, 27594, 740, 745, 33, 98, 38415, 38415, 31728));
deff.Items.Add(new HeatMapItem("Princeton University", 2, 10, 7724, 745, 740, 33, 99, 36640, 36640, 16502));
deff.Items.Add(new HeatMapItem("Yale University", 3, 10, 11701, 745, 750, 32, 99, 38300, 38300, 19374));
deff.Items.Add(new HeatMapItem("California Institute of Technology", 4, 17, 2175, 785, 730, 34, 98, 36282, 36282, 1772));
deff.Items.Add(new HeatMapItem("Massachusetts Institute of Technology", 5, 12, 10566, 760, 710, 33, 97, 39212, 39212, 9712));
deff.Items.Add(new HeatMapItem("Stanford University", 6, 9, 19535, 730, 705, 32, 98, 40172, 40172, 13851));
deff.Items.Add(new HeatMapItem("Williams College", 7, 17, 2101, 710, 710, 31, 96, 41434, 41434, 1784));
deff.Items.Add(new HeatMapItem("Amherst College", 8, 15, 1794, 710, 710, 31, 96, 40862, 40862, 1641));
deff.Items.Add(new HeatMapItem("Pomona College", 9, 16, 1560, 735, 740, 32, 97, 38394, 38394, 1700));
deff.Items.Add(new HeatMapItem("Swarthmore College", 10, 16, 1524, 715, 720, 31, 94, 39600, 39600, 1508));
deff.Items.Add(new HeatMapItem("University of Chicago", 11, 28, 15152, 705, 715, 31, 98, 42041, 42041, 6575));
this.radHeatMap1.Definition = deff;
Dim PoorColor As Color = ColorTranslator.FromHtml("#FFE9F3FF")
Dim GoodColor As Color = ColorTranslator.FromHtml("#FF1F78B4")
Dim SmartRankColorizer As HeatMapRangeColorizer = New HeatMapRangeColorizer() With {
    .IsAbsolute = False,
    .Colors = New HeatMapRangeColorCollection() From {
        New HeatMapRangeColor() With {
            .From = 0,
            .[To] = 0.25,
            .Color = Color.Yellow
        },
        New HeatMapRangeColor() With {
            .From = 0.25,
            .[To] = 0.5,
            .Color = Color.Orange
        },
        New HeatMapRangeColor() With {
            .From = 0.5,
            .[To] = 0.75,
            .Color = Color.Red
        },
        New HeatMapRangeColor() With {
            .From = 0.75,
            .[To] = 1,
            .Color = Color.Brown
        }
    }
}
Dim AcceptanceRateColorizer As HeatMapDesaturationColorizer = New HeatMapDesaturationColorizer() With {
    .StartColor = Color.Green,
    .From = 1,
    .[To] = 0.2
}
Dim EnrolledStudentsColorizer As HeatMapGradientColorizer = New HeatMapGradientColorizer()
EnrolledStudentsColorizer.GradientStops = New List(Of GradientStop)() From {
    New GradientStop() With {
        .Position = 0F,
        .Color = Color.Red
    },
    New GradientStop() With {
        .Position = 0.5F,
        .Color = Color.Yellow
    },
    New GradientStop() With {
        .Position = 1F,
        .Color = Color.YellowGreen
    }
}
Dim SATMathScoreColorizer As HeatMapGradientColorizer = New HeatMapGradientColorizer()
SATMathScoreColorizer.GradientStops = New List(Of GradientStop)() From {
    New GradientStop() With {
        .Position = 0F,
        .Color = PoorColor
    },
    New GradientStop() With {
        .Position = 1F,
        .Color = GoodColor
    }
}
Dim SATVerbalScoreColorizer As HeatMapGradientColorizer = New HeatMapGradientColorizer()
SATVerbalScoreColorizer.GradientStops = New List(Of GradientStop)() From {
    New GradientStop() With {
        .Position = 0F,
        .Color = PoorColor
    },
    New GradientStop() With {
        .Position = 1F,
        .Color = GoodColor
    }
}
Dim SATCompositeScoreColorizer As HeatMapGradientColorizer = New HeatMapGradientColorizer()
SATCompositeScoreColorizer.GradientStops = New List(Of GradientStop)() From {
    New GradientStop() With {
        .Position = 0F,
        .Color = PoorColor
    },
    New GradientStop() With {
        .Position = 1F,
        .Color = GoodColor
    }
}
Dim deff As VerticalDefinition = New VerticalDefinition()
deff.MemberMappings = New MemberMappingsCollection() From {
    New MemberMapping() With {
        .Header = "Smart Rank",
        .ValueMember = "SmartRank",
        .Colorizer = SmartRankColorizer
    },
    New MemberMapping() With {
        .Header = "Acceptance Rate (%)",
        .ValueMember = "AcceptanceRate",
        .Colorizer = AcceptanceRateColorizer
    },
    New MemberMapping() With {
        .Header = "Total Enrolled Students",
        .ValueMember = "TotalEnrolledStudents",
        .Colorizer = EnrolledStudentsColorizer
    },
    New MemberMapping() With {
        .Header = "AVG SAT Math Score",
        .ValueMember = "AverageSATMathScore",
        .Colorizer = SATMathScoreColorizer
    },
    New MemberMapping() With {
        .Header = "AVG SAT Verbal Score",
        .ValueMember = "AverageSATVerbalScore",
        .Colorizer = SATVerbalScoreColorizer
    }
}
deff.Items.Add(New HeatMapItem("Harvard University", 1, 8, 27594, 740, 745, 33, 98, 38415, 38415, 31728))
deff.Items.Add(New HeatMapItem("Princeton University", 2, 10, 7724, 745, 740, 33, 99, 36640, 36640, 16502))
deff.Items.Add(New HeatMapItem("Yale University", 3, 10, 11701, 745, 750, 32, 99, 38300, 38300, 19374))
deff.Items.Add(New HeatMapItem("California Institute of Technology", 4, 17, 2175, 785, 730, 34, 98, 36282, 36282, 1772))
deff.Items.Add(New HeatMapItem("Massachusetts Institute of Technology", 5, 12, 10566, 760, 710, 33, 97, 39212, 39212, 9712))
deff.Items.Add(New HeatMapItem("Stanford University", 6, 9, 19535, 730, 705, 32, 98, 40172, 40172, 13851))
deff.Items.Add(New HeatMapItem("Williams College", 7, 17, 2101, 710, 710, 31, 96, 41434, 41434, 1784))
deff.Items.Add(New HeatMapItem("Amherst College", 8, 15, 1794, 710, 710, 31, 96, 40862, 40862, 1641))
deff.Items.Add(New HeatMapItem("Pomona College", 9, 16, 1560, 735, 740, 32, 97, 38394, 38394, 1700))
deff.Items.Add(New HeatMapItem("Swarthmore College", 10, 16, 1524, 715, 720, 31, 94, 39600, 39600, 1508))
deff.Items.Add(New HeatMapItem("University of Chicago", 11, 28, 15152, 705, 715, 31, 98, 42041, 42041, 6575))
Me.radHeatMap1.Definition = deff
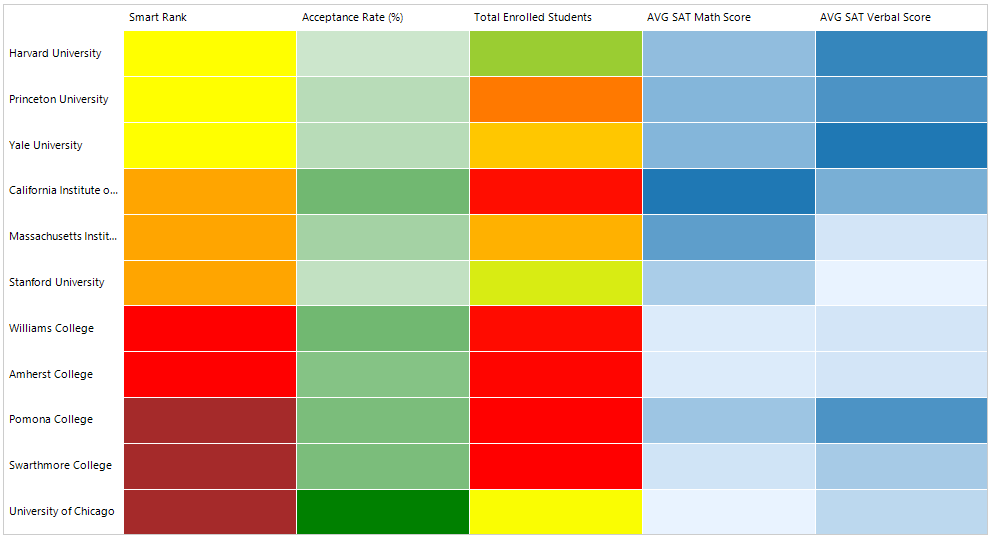
Here is how the control will look if we used VerticalDefinition with the same data.