GridViewSparklineColumn
GridViewSparklineColumn allows a Sparkline chart to be displayed in the RadGridView. GridViewSparklineColumn can be one of the following types: SparkAreaSeries, SparkBarSeries, SparkLineSeries, SparkScatterSeries, SparkWinLossSeries.

Add GridViewSparklineColumn to the grid.
The following code snippet demonstrates how to create and add GridViewSparklineColumn to RadGridView with some sample data added in it:
 GridViewSparklineColumn sparkLineColumn = new GridViewSparklineColumn();
 sparkLineColumn.SeriesType = SparkSeriesType.Line;
 sparkLineColumn.Name = "Line";
 sparkLineColumn.FieldName = "Line";
 sparkLineColumn.HeaderText = "SparkLineColumn";
 sparkLineColumn.ShowHighPointIndicator = true;
 sparkLineColumn.ShowFirstPointIndicator = true;
 sparkLineColumn.ShowLastPointIndicator = true;
 sparkLineColumn.ShowNegativePointIndicators = true;
 this.radGridView1.Columns.Add(sparkLineColumn);

     GridViewRowInfo row = this.radGridView1.Rows.AddNew();
     double[] values = new double[12];
     for (int i = 0; i < values.Length; i++)
     {
         values[i] = rand.Next(-100, 100);
     }
     row.Cells["Line"].Value = values;

     row = this.radGridView1.Rows.AddNew();
     values = new double[12];
     for (int i = 0; i < values.Length; i++)
     {
         values[i] = rand.Next(-100, 100);
     }
     row.Cells["Line"].Value = values;

     row = this.radGridView1.Rows.AddNew();
     values = new double[12];
     for (int i = 0; i < values.Length; i++)
     {
         values[i] = rand.Next(-100, 100);
     }
     row.Cells["Line"].Value = values;

     row = this.radGridView1.Rows.AddNew();
     values = new double[12];
     for (int i = 0; i < values.Length; i++)
     {
         values[i] = rand.Next(-100, 100);
     }
     row.Cells["Line"].Value = values;

     row = this.radGridView1.Rows.AddNew();
     values = new double[12];
     for (int i = 0; i < values.Length; i++)
     {
         values[i] = rand.Next(-100, 100);
     }
     row.Cells["Line"].Value = values;
Dim sparkLineColumn As GridViewSparklineColumn = New GridViewSparklineColumn()
sparkLineColumn.SeriesType = SparkSeriesType.Line
sparkLineColumn.Name = "Line"
sparkLineColumn.FieldName = "Line"
sparkLineColumn.HeaderText = "SparkLineColumn"
sparkLineColumn.ShowHighPointIndicator = True
sparkLineColumn.ShowFirstPointIndicator = True
sparkLineColumn.ShowLastPointIndicator = True
sparkLineColumn.ShowNegativePointIndicators = True
RadGridView1.Columns.Add(sparkLineColumn)

Dim row As GridViewRowInfo = Me.radGridView1.Rows.AddNew()
    Dim values As Double() = New Double(11) {}
    For i As Integer = 0 To values.Length - 1
        values(i) = rand.[Next](-100, 100)
    Next
    row.Cells("Line").Value = values

    Dim values As Double() = New Double(11) {}
    For i As Integer = 0 To values.Length - 1
        values(i) = rand.[Next](-100, 100)
    Next
    row.Cells("Line").Value = values

    Dim values As Double() = New Double(11) {}
    For i As Integer = 0 To values.Length - 1
        values(i) = rand.[Next](-100, 100)
    Next
    row.Cells("Line").Value = values

    Dim values As Double() = New Double(11) {}
    For i As Integer = 0 To values.Length - 1
        values(i) = rand.[Next](-100, 100)
    Next
    row.Cells("Line").Value = values

    Dim values As Double() = New Double(11) {}
    For i As Integer = 0 To values.Length - 1
        values(i) = rand.[Next](-100, 100)
    Next
    row.Cells("Line").Value = values
SparkDataNeeded event
The SparkDataNeeded event can be used to dynamically populate or change data at run-time. It is fired right before creating the data points inside the sparkline element in the cell.
 private void SparkLineColumn_SparkDataNeeded(object sender, SparkDataNeededEventArgs e)
 {
     GridSparklineCellElement gridSparklineCellElement = sender as GridSparklineCellElement;
     if (gridSparklineCellElement == null)
     {
         return;
     }

     var myValues = new double[6];
     for (int i = 0; i < 6; i++)
     {
         myValues[i] = rand.Next(-100, 100);
     }

     e.Values = myValues;
 }
Private Sub SparkLineColumn_SparkDataNeeded(ByVal sender As Object, ByVal e As SparkDataNeededEventArgs)
    Dim gridSparklineCellElement As GridSparklineCellElement = TryCast(sender, GridSparklineCellElement)

    If gridSparklineCellElement Is Nothing Then
        Return
    End If
    Dim myValues = New Double(5) {}

    For i As Integer = 0 To 6 - 1
        myValues(i) = rand.[Next](-100, 100)
    Next
    e.Values = myValues
End Sub
Binding GridViewSparklineColumn
You can bind the GridViewSparklineColumn to any IEnumerable collection of numeric data types. To do this, you should set the FieldName of the GridViewSparklineColumn to be the same as the name of the appopriate existing column in the data source. The example below binds the grid to DataTable via the DataSource property. To prevent the grid from traversing all data fields in that collection, I set the GridViewTemplate.AutoGenerateColumns property to False.
DataTable dt = new DataTable();
dt.Columns.Add("Id",typeof(int));
dt.Columns.Add("Name",typeof(string));
dt.Columns.Add("Points", typeof(double[]));

Random rand = new Random();
for (int i = 0; i < 5; i++)
{
    double[] pointsValues = new double[12];
    for (int j = 0; j < pointsValues.Length; j++)
    {
        pointsValues[j]=rand.Next(-100, 100);
    }

    dt.Rows.Add(i,"Row"+i, pointsValues);
}

this.radGridView1.MasterTemplate.AutoGenerateColumns = false;
this.radGridView1.DataSource = dt;

GridViewSparklineColumn sparkLineColumn = new GridViewSparklineColumn("Points");
sparkLineColumn.SeriesType = SparkSeriesType.Line;
sparkLineColumn.FieldName = "Points";
sparkLineColumn.HeaderText = "Points";
this.radGridView1.Columns.Add(sparkLineColumn);
    Dim dt As DataTable = New DataTable()
    dt.Columns.Add("Id", GetType(Integer))
    dt.Columns.Add("Name", GetType(String))
    dt.Columns.Add("Points", GetType(Double()))

    Dim rand As Random = New Random()
    For i As Integer = 0 To 5 - 1
        Dim pointsValues As Double() = New Double(11) {}

        For j As Integer = 0 To pointsValues.Length - 1
            pointsValues(j) = rand.[Next](-100, 100)
        Next

        dt.Rows.Add(i, "Row" & i, pointsValues)
    Next

    Me.RadGridView1.MasterTemplate.AutoGenerateColumns = False
    Me.RadGridView1.DataSource = dt
    Dim sparkLineColumn As GridViewSparklineColumn = New GridViewSparklineColumn("Points")
    sparkLineColumn.SeriesType = SparkSeriesType.Line
    sparkLineColumn.FieldName = "Points"
    sparkLineColumn.HeaderText = "Points"
    Me.RadGridView1.Columns.Add(sparkLineColumn)
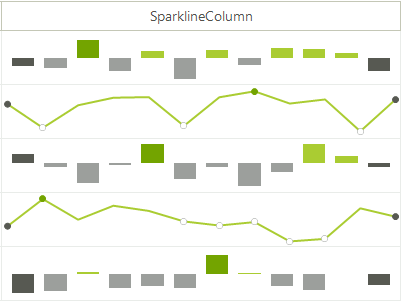
Customize GridViewSparklineColumn
GridViewSparklineColumn can be customized by making use of CellFormatting event. Here is an example how to make the even rows in GridViewSparklineColumn to desplay bar series, and the odd rows to display line series. Due to the UI Virtualization, an if-else statement is used to reset the series.
private void RadGridView1_CellFormatting(object sender, CellFormattingEventArgs e)
{
    GridViewSparklineColumn sparklineColumn = e.CellElement.ColumnInfo as GridViewSparklineColumn;
    if (sparklineColumn != null)
    {
        GridSparklineCellElement sparklineCellElement = sender as GridSparklineCellElement;
        if (sparklineCellElement == null || sparklineCellElement.SparklineElement.Series == null)
        {
            return;
        }

        SparkCartesianSeries series = null;
        if (e.CellElement.RowIndex % 2 == 0)
        {
            series = new SparkBarSeries();
        }
        else
        {
            series = new SparkLineSeries();
        }

        series.ShowFirstPointIndicator = sparklineColumn.ShowFirstPointIndicator;
        series.ShowLastPointIndicator = sparklineCellElement.SparklineElement.Series.ShowLastPointIndicator;
        series.ShowHighPointIndicator = sparklineCellElement.SparklineElement.Series.ShowHighPointIndicator;
        series.ShowLowPointIndicator = sparklineCellElement.SparklineElement.Series.ShowLowPointIndicator;
        series.ShowNegativePointIndicators = sparklineCellElement.SparklineElement.Series.ShowNegativePointIndicators;

        SparkDataPoint[] values = new SparkDataPoint[sparklineCellElement.SparklineElement.Series.DataPoints.Count];
        sparklineCellElement.SparklineElement.Series.DataPoints.CopyTo(values, 0);
        sparklineCellElement.SparklineElement.Series.DataPoints.Clear();

        series.DataPoints.AddRange(values);
        sparklineCellElement.SparklineElement.Series = series;
    }
}
Private Sub RadGridView1_CellFormatting(ByVal sender As Object, ByVal e As CellFormattingEventArgs)
    Dim sparklineColumn As GridViewSparklineColumn = TryCast(e.CellElement.ColumnInfo, GridViewSparklineColumn)

    If sparklineColumn IsNot Nothing Then
        Dim sparklineCellElement As GridSparklineCellElement = TryCast(sender, GridSparklineCellElement)

        If sparklineCellElement Is Nothing OrElse sparklineCellElement.SparklineElement.Series Is Nothing Then
            Return
        End If

        Dim series As SparkCartesianSeries = Nothing

        If e.CellElement.RowIndex Mod 2 = 0 Then
            series = New SparkBarSeries()
        Else
            series = New SparkLineSeries()
        End If

        series.ShowFirstPointIndicator = sparklineColumn.ShowFirstPointIndicator
        series.ShowLastPointIndicator = sparklineCellElement.SparklineElement.Series.ShowLastPointIndicator
        series.ShowHighPointIndicator = sparklineCellElement.SparklineElement.Series.ShowHighPointIndicator
        series.ShowLowPointIndicator = sparklineCellElement.SparklineElement.Series.ShowLowPointIndicator
        series.ShowNegativePointIndicators = sparklineCellElement.SparklineElement.Series.ShowNegativePointIndicators
        Dim values As SparkDataPoint() = New SparkDataPoint(sparklineCellElement.SparklineElement.Series.DataPoints.Count - 1) {}
        sparklineCellElement.SparklineElement.Series.DataPoints.CopyTo(values, 0)
        sparklineCellElement.SparklineElement.Series.DataPoints.Clear()
        series.DataPoints.AddRange(values)
        sparklineCellElement.SparklineElement.Series = series
    End If
End Sub
GridViewSparklineColumn's Properties
| Property | Description |
|---|---|
| SeriesType | Gets or sets a value indicating what is the type of the generated series. |
| ShowTooltip | Gets or sets a value whether tooltips on the point markers will be shown. |
| ShowMarkers | Gets or sets a value indicating whether the point markers will be shown. |
| ShowHighPointIndicator | Gets or sets a value indicating whether the high point marker will be shown. |
| ShowLowPointIndicator | Gets or sets a value indicating whether the low point marker will be shown. |
| ShowFirstPointIndicator | Gets or sets a value indicating whether the first point marker will be shown. |
| ShowLastPointIndicator | Gets or sets a value indicating whether the last point marker will be shown. |
| ShowNegativePointIndicators | Gets or sets a value indicating whether the negative points marker will be shown. |
| AllowSearching | Gets or sets a value indicating whether the user can search by this column. |
| AllowFiltering | Gets or sets a value indicating whether the user can filter by this column. |
GridViewSparklineColumn's Events
| Event | Description |
|---|---|
| PaintSparkFill | Fires when a spark fill will be painted using a specific solid brush. |
| PaintSparkStroke | Fires when a spark line will be painted using a specific Pen. |
| SparkDataNeeded | Fires before adding data points to the SparkSeries. It is possible to cancel the event and bind the series. |
| SparklineElementExporting | Fires while exporting or printing the sparkline cell element, allows customization of the series. |