Supported Indicators
The article provides a brief description and a list of the important properties of each indicator supported by RadChartView. The indicators are divided in the following groups: Moving Average, Bands, Momentum and Volatility.
The StochasticSlowIndicator, StochasticFastIndicator, MacdIndicator, and BollingerBandsIndicator consist of two lines visually representing the result of the calculations. Each of these indicators exposes the ChildIndicator property providing means for accessing the second series line.
Moving Average Indicators
Moving Average (MA), aka Simple Moving Average (SMA), provides an average value of the past N-days data. Its Period property defines N – the number of past days it uses to calculate its current value.
Exponential Moving Average (EMA) is calculated on three stages: (1) calculate the simple moving average, (2) calculate the weighting multiplier, and (3) calculate the exponential moving average. The formula can be expressed as follows: EMA = currentPrice * SF + previousEMA * (1 – SF), where SF = 2 / (N + 1) Because it uses simple moving average, the EMA exposes a Period property which sets N in the formula above.
Modified Exponential Moving Average (MEMA) differs from EMA only by the calculation of SF: EMA = currentPrice * SF + previousEMA * (1 – SF), where SF = 1 / N
Modified Moving Average (MMA) calculates the value of its first point just like the simple moving average indicator. Each subsequent point, however, is produced by adding the new price and subtracting the last average. The Period property defines the period of the simple moving average indicator
Weighted Moving Average (WMA) applies multiplying factors to past values before averaging them in order to give data different weights. The multiplier for each past datum is fraction where the numerator is the numeral of the day number and the denominator is the sum of days as a triangular number. This approach ensures that more recent data have higher weights. Because WMA uses simple moving average it exposes a Period property which determines the number of past days data used in the calculations.
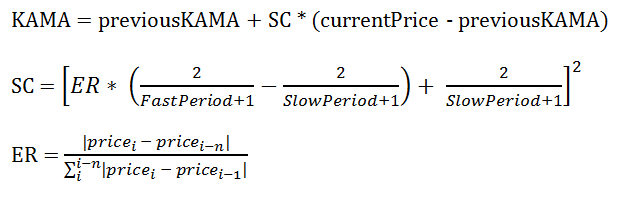
Kaufman Adaptive Moving Average (KAMA) uses three parameters to calculate its value: Period, SlowPeriod and FastPeriod. The formula of the indicator is:
Figure 1: Kaufman Formula
Momentum Indicators
Moving Average Convergence Divergence (MACD) is one of the most frequently used indicators. It constructs two exponential moving averages and subtracts them to end up with an oscillator. The two EMAs use different Periods, defined by the ShortPeriod and LongPeriod properties of the MACD, and are often referred to as short EMA and long EMA, respectively. Once the long EMA is subtracted from the short EMA, MACD uses the differences to feed a third EMA with period determined by the SignalPeriod. The following steps give a simplified explanation of the MACD construction:
Creates a short Exponential Moving Average with period equal to the ShortPeriod property.
Creates a long Exponential Moving Average with period equal to the LongPeriod property.
Subtract the long EMA values from the short EMA values and use the differences to construct a third EMA with period determined by the SignalPeriod property.
Relative Strength Index (RSI) is extremely popular indicator that measures the speed and change of price movements. It uses the following formula: RSI = 100 – 100 / RSRS = Average Gain / Average Loss
Commodity Channel Index (CCI) is based on the notion of Typical Prices defined by the average of the current high, low and close values. CCI calculation involves the following steps:
Calculate the Typical Price, where TP = (High + Close + Low) / 3
Calculate the Moving Average of the Typical Prices (MATP)
Calculate the Mean Deviation (MD)
Calculate the Commodity Channel Index, where CCI = (TP – MATP) / (0.0015 * MD)
Stochastic Fast indicator consists of two lines, called %K and %D. The former is calculated based on the following formula: %K = (CurrentClose – PeriodLow) / (PeriodHigh - PeriodLow) * 100Where PeriodLow__is the lowest Low of the __MainPeriod and the PeriodHigh is the highest High in the MainPeriod. The %D line is indeed a simple Moving Average of the %K values with period determined by the SignalPeriod property.
Stochastic Slow is highly similar to the Stochastic Fast indicator. Their main difference, however, is sensitivity. The %K line of the Stochastic Slow indicator is the %D line of the Stochastic Fast indicator. Further, the %D of the Stochastic Slow indicator is again the Simple Moving Average of the %K line using period determined by the SlowingPeriod property.
Triple Exponential Average (TRIX) is the derivative of a triple-smoothed Exponential Moving Average. Its calculation involves the following steps:
Create an N-day Exponential Moving Average (EMA1) using the closing prices
Create an N-day Exponential Moving Average (EMA2) using the values of EMA1
Create an N-day Exponential Moving Average (EMA3) using the values of EMA2
Calculate the difference between current EMA3 and previous EMA3 value in that final smoothed series
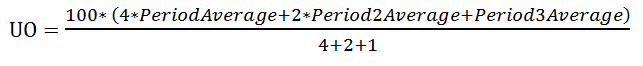
- Relative Momentum Index (RMI) was created by modifying the Relative Strength Indicator (RSI). The changed formula is RMI = RM / (1 + RM)Where RM = average up momentum (over N-period) / average down momentum (over N-period)
Figure 2: Relative Momentum
Momentum indicator is designed to identify the speed of price movement. RadChartView uses the following formula to calculate the Momentum values: M = (CurrentPrice – NPrice) * 100, where NPrice is the closing price N days ago
Rate of Change (ROC) is highly similar to the Momentum indicator. The modified formula is: ROC = 100 * (CurrentPrice – NPrice) / NPrice, where NPrice is the closing price N days ago
Oscillator indicator creates two averages – short averages, which takes the ShortPeriod number of previous values, and the long average, which uses the LongPeriod number of previous data. The oscillator uses the difference of the short and the long averages divided by the short average to produce its final values.
Rapid Adaptive Variance Indicator (RAVI) measures trend intensity instead of trend direction. RAVI is highly similar to the Oscillator indicator – it uses short and long averages of the previous data. Their difference is in the final step of calculations. Unlike Oscillator, RAVI divides the difference of the long and short averages by the long average. The result is again multiplied by 100.
Volatility Indicators
True Range indicator measures volatility. Its first value is the difference of the high and low values for the day. Each consecutive value is equal to the greatest of the following: previous close value minus the current low value, and the current high value minus the previous close value.
Average True Range is the simple Moving Average of the True Range indicator
Band Indicators
- Bollinger Bands consists of two bands that aim to provide a relative definition of high and low. The indicator uses a simple Moving Average as a starting point and forms its two bands using the following formulas: Upper band: MA + (N-period standard deviation * K)Lower band: MA – (N-period standard deviation * K)N is defined by the Period property. A typical value for N is 20.K is defined by the StandardDeviations property. A typical value for K is 2.