Custom Indicators
This article aims to demonstrate how to create indicators that use custom built-in formulas. The first indicator to be set up is Disparity Index indicator and second is a two-line Moving Average Envelopes indicator.
Disparity Index (DI)
Disparity Index (DI) indicator is described by its creator Steve Nison as "a percentage display of the latest close to a chosen moving average". A generalized formula of the DI can be defined as follows:
DI = ((CurrentClose – MA) / MA) * 100
The MA notation in the above formula stands for any Moving Average indicator. This example will use Exponential Moving Average, so the formula will be rather:
DI = ((CurrentClose - EMA) / EMA) * 100
The formula suggests that DI needs to use the calculations of the EMA indicator and the closing price value coming from the data source. To achieve the desired outcome we will need to (1) create a class that inherits EMA, and (2) override the GetProcessedValue method to return the modified value. The CurrentClose value in the formula can be drawn from the BaseValue property of the current indicator’s data point. All Moving Average indicators use data points of type IdicatorValueDataPoint. Specifically designed to work with indicators, these data points contain a field called BaseValue which is indeed the unprocessed value fetched from the data source.
Now that we have all variables from the formula above, let us start constructing our indicator. First, create a class DisparityIndexIndicator that inherits ExponantialMovingAverage and override the GetProcessedValue method. The method has a parameter currentIndex, which allows you to extract the reach the current data point and extract its BaseValue. To get the EMA calculated value, use the base GetProcessedValue method. The only step left is to calculate and return the modified value. Here is how your code should look like:
DI Indicator
public class DisparityIndexIndicator: ExponentialMovingAverageIndicator
{
    public override double GetProcessedValue(int currentIndex)
    {
        double close = (this.DataPoints[currentIndex] as IndicatorValueDataPoint).BaseValue;
        double ema = base.GetProcessedValue(currentIndex);
        double result = ((close - ema) / ema) * 100;
        return result;
    }
}
Public Class DisparityIndexIndicator
    Inherits ExponentialMovingAverageIndicator
    Public Overrides Function GetProcessedValue(currentIndex As Integer) As Double
        Dim close As Double = TryCast(Me.DataPoints(currentIndex), IndicatorValueDataPoint).BaseValue
        Dim ema As Double = MyBase.GetProcessedValue(currentIndex)
        Dim result As Double = ((close - ema) / ema) * 100
        Return result
    End Function
End Class
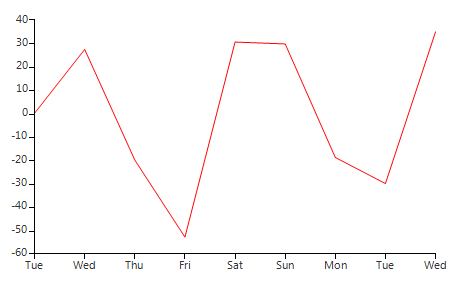
Now let’s create a new DI indicator instance and add it to our RadChartView. In order to do that, however, we will need some sample data. The snippet below creates a BindingList of ClosingPriceObjects. Each ClosingPriceObject is a simple structure that holds the closing price and date it was registered. The class implements INotifyPropertyChanged in order to make sure that any changes in the object's data will be reflected in the indicator’s values.
Figure 1: DI Indicator
Custom Object
public class ClosingPriceObject : INotifyPropertyChanged
{
    private double close;
    private DateTime date;
    public ClosingPriceObject(double close, DateTime date)
    {
        this.close = close;
        this.date = date;
    }
    public double Close
    {
        get
        {
            return this.close;
        }
        set
        {
            this.close = value;
            OnNotifyPropertyChanged("Close");
        }
    }
    public DateTime Date
    {
        get
        {
            return this.date;
        }
        set
        {
            this.date = value;
            OnNotifyPropertyChanged("Date");
        }
    }
    public event PropertyChangedEventHandler PropertyChanged;
    public void OnNotifyPropertyChanged(string propertyName)
    {
        PropertyChangedEventHandler handler = PropertyChanged;
        if (handler != null)
        {
            this.PropertyChanged(this, new PropertyChangedEventArgs(propertyName));
        }
    }
}
Public Class ClosingPriceObject
    Implements INotifyPropertyChanged
    Private m_close As Double
    Private m_date As DateTime
    Public Property Close() As Double
        Get
            Return Me.m_close
        End Get
        Set(value As Double)
            Me.m_close = value
            OnNotifyPropertyChanged("Close")
        End Set
    End Property
    Public Property [Date]() As DateTime
        Get
            Return Me.m_date
        End Get
        Set(value As DateTime)
            Me.m_date = value
            OnNotifyPropertyChanged("Date")
        End Set
    End Property
    Public Sub New(close As Double, [date] As DateTime)
        Me.Close = close
        Me.[Date] = [date]
    End Sub
    Public Event PropertyChanged As PropertyChangedEventHandler Implements INotifyPropertyChanged.PropertyChanged
    Public Sub OnNotifyPropertyChanged(propertyName As String)
        RaiseEvent PropertyChanged(Me, New PropertyChangedEventArgs(propertyName))
    End Sub
End Class
Create Data
BindingList<ClosingPriceObject> dataSource = new BindingList<ClosingPriceObject>();
dataSource.Add(new ClosingPriceObject(4, DateTime.Now));
dataSource.Add(new ClosingPriceObject(7, DateTime.Now.AddDays(1)));
dataSource.Add(new ClosingPriceObject(4, DateTime.Now.AddDays(2)));
dataSource.Add(new ClosingPriceObject(2, DateTime.Now.AddDays(3)));
dataSource.Add(new ClosingPriceObject(6, DateTime.Now.AddDays(4)));
dataSource.Add(new ClosingPriceObject(7, DateTime.Now.AddDays(5)));
dataSource.Add(new ClosingPriceObject(4, DateTime.Now.AddDays(6)));
dataSource.Add(new ClosingPriceObject(3, DateTime.Now.AddDays(7)));
dataSource.Add(new ClosingPriceObject(7, DateTime.Now.AddDays(8)));
Dim dataSource As New BindingList(Of ClosingPriceObject)()
dataSource.Add(New ClosingPriceObject(4, DateTime.Now))
dataSource.Add(New ClosingPriceObject(7, DateTime.Now.AddDays(1)))
dataSource.Add(New ClosingPriceObject(4, DateTime.Now.AddDays(2)))
dataSource.Add(New ClosingPriceObject(2, DateTime.Now.AddDays(3)))
dataSource.Add(New ClosingPriceObject(6, DateTime.Now.AddDays(4)))
dataSource.Add(New ClosingPriceObject(7, DateTime.Now.AddDays(5)))
dataSource.Add(New ClosingPriceObject(4, DateTime.Now.AddDays(6)))
dataSource.Add(New ClosingPriceObject(3, DateTime.Now.AddDays(7)))
dataSource.Add(New ClosingPriceObject(7, DateTime.Now.AddDays(8)))
{{endregion}}
SetupDIIndicator
{{source=..\SamplesCS\ChartView\Series\Indicators\CustomIndicatorsDIForm.cs region=SetupDIIndicator}} {{source=..\SamplesVB\ChartView\Series\Indicators\CustomIndicatorsDIForm.vb region=SetupDIIndicator}}
DisparityIndexIndicator indicator = new DisparityIndexIndicator();
indicator.ValueMember = "Close";
indicator.CategoryMember = "Date";
indicator.DataSource = dataSource;
indicator.Period = 5;
indicator.BorderColor = Color.Red;
indicator.PointSize = SizeF.Empty;
this.radChartView1.Series.Add(indicator);
Dim indicator As New DisparityIndexIndicator
indicator.Period = 5
indicator.ValueMember = "Close"
indicator.CategoryMember = "Date"
indicator.DataSource = dataSource
indicator.BorderColor = Color.Red
indicator.PointSize = SizeF.Empty
Me.RadChartView1.Series.Add(indicator)
Moving Average Envelopes (MAE)
Moving Average Envelopes (MAE) is a slightly more complex indicator as it contains two bands, frequently referred to as Envelopes. The indicator uses Simple Moving Average as a starting point and shifts its two bands upwards and downwards to form the envelopes above and below the moving average. The percentage formula used to calculate the envelopes is:
UpperEnvelope = MA + (U% * MA)
LowerEnvelope = MA + (L% * MA)
Where U% is the Upper Percentage and L% is the lower percentage
All two-line indicators in RadChartView follow a specific pattern – the main indicator implements the IParentIndicator interface and the nested indicator implements the IChildIndicator interface. Once you have implemented these two interfaces, RadChartView will be in charge of attaching and rendering the two lines correctly.
Figure 2: Moving Average indicator
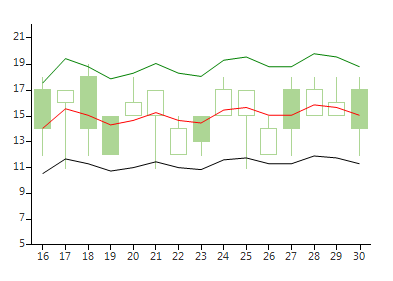
Because Moving Average Envelopes requires a property that sets the bands percent (assuming that both bands will use the same percent), we will create a MAE base that inherits the Moving Average indicator__and adds a __Percent property. Here is a sample snippet:
Base Class
public class MovingAverageEnvelopeBase : MovingAverageIndicator
{
    public static readonly RadProperty PercentProperty = RadProperty.Register("Percent", typeof(double), typeof(MovingAverageEnvelopeBase), new RadPropertyMetadata(0d));
    public double Percent
    {
        get
        {
            return (double)GetValue(PercentProperty);
        }
        set
        {
            SetValue(PercentProperty, value);
        }
    }
}
Public Class MovingAverageEnvelopeBase
    Inherits MovingAverageIndicator
    Public Shared ReadOnly PercentProperty As RadProperty = RadProperty.Register("Percent", GetType(Double), GetType(MovingAverageEnvelopeBase), New RadPropertyMetadata(0.0))
    Public Property Percent() As Double
        Get
            Return CDbl(GetValue(PercentProperty))
        End Get
        Set(value As Double)
            SetValue(PercentProperty, value)
        End Set
    End Property
End Class
Let’s now create two classes: MovingAverageEnvelopeChild, containing the lower band’s logic and MovingAverageEnvelopeIndicator, holding the upper band’s formula. They should both inherit MovingAverageEnvelopeBase class. Here are the steps that set up the MovingAverageEnvelopeChild class, first, make sure the MovingAverageEnvelopeChild class implements the IChildIndicator interface. Further, add a field that holds the parent indicator and use it when implementing the OwnerIndicator property. Also, override the GetProcessedValue method and use the Percent property to calculate the correct lower envelope value. Here is a sample snippet of the MovingAverageEnvelopeChild:
Child Class
public class MovingAverageEnvelopeChild : MovingAverageEnvelopeBase, IChildIndicator
{
    MovingAverageEnvelopeIndicator owner;
    public MovingAverageEnvelopeChild(MovingAverageEnvelopeIndicator owner)
    {
        this.owner = owner;
    }
    public IndicatorBase OwnerIndicator
    {
        get { return this.owner; }
    }
    public override double GetProcessedValue(int currentIndex)
    {
        double movingAverage = base.GetProcessedValue(currentIndex);
        double result = movingAverage - (movingAverage * this.Percent);
        return result;
    }
}
Public Class MovingAverageEnvelopeChild
    Inherits MovingAverageEnvelopeBase
    Implements IChildIndicator
    Private owner As MovingAverageEnvelopeIndicator
    Public Sub New(owner As MovingAverageEnvelopeIndicator)
        Me.owner = owner
    End Sub
    Public ReadOnly Property OwnerIndicator() As IndicatorBase Implements IChildIndicator.OwnerIndicator
        Get
            Return Me.owner
        End Get
    End Property
    Public Overrides Function GetProcessedValue(currentIndex As Integer) As Double
        Dim movingAverage As Double = MyBase.GetProcessedValue(currentIndex)
        Dim result As Double = movingAverage - (movingAverage * Me.Percent)
        Return result
    End Function
End Class
The MovingAverageEnvelopeIndicator class requires a bit more steps that the indicator child. First, make the class implement the IParentIndicator interface. Create a field of type MovingAverageEnvelopeChild, initialize it in the indicator’s constructor, and return it when implementing the ChildIndicator property. To make sure the inner indicator will be attached and detached, override both OnAttached and OnDettached methods and manually attach and detach the ChildIndicator. To ensure the inner indicator will be bound properly, override the OnNotifyPropertyChanged method and pass any important property values to the child indicator. Here is a sample snippet:
MAE Indicator
public class MovingAverageEnvelopeIndicator : MovingAverageEnvelopeBase, IParentIndicator
{
    MovingAverageEnvelopeChild childIndicator;
    public MovingAverageEnvelopeIndicator()
    {
        childIndicator = new MovingAverageEnvelopeChild(this);
    }
    public IndicatorBase ChildIndicator
    {
        get { return this.childIndicator; }
    }
    public override double GetProcessedValue(int currentIndex)
    {
        double movingAverage = base.GetProcessedValue(currentIndex);
        double result = movingAverage + (movingAverage * this.Percent);
        return result;
    }
    protected override void OnAttached(UIChartElement parent)
    {
        base.OnAttached(parent);
        this.ChildIndicator.Attach(parent);
    }
    protected override void OnDettached()
    {
        base.OnDettached();
        this.ChildIndicator.Dettach();
    }
    protected override void OnNotifyPropertyChanged(System.ComponentModel.PropertyChangedEventArgs e)
    {
        base.OnNotifyPropertyChanged(e);
        if (e.PropertyName == "DataSource")
        {
            this.childIndicator.DataSource = this.DataSource;
        }
        if (e.PropertyName == "CategoryMember")
        {
            this.childIndicator.CategoryMember = this.CategoryMember;
        }
        if (e.PropertyName == "ValueMember")
        {
            this.childIndicator.ValueMember = this.ValueMember;
        }
        if (e.PropertyName == "Period")
        {
            this.childIndicator.Period = this.Period;
        }
        if (e.PropertyName == "Percent")
        {
            this.childIndicator.Percent = this.Percent;
        }
    }
}
Public Class MovingAverageEnvelopeIndicator
    Inherits MovingAverageEnvelopeBase
    Implements IParentIndicator
    Private m_childIndicator As MovingAverageEnvelopeChild
    Public Sub New()
        m_childIndicator = New MovingAverageEnvelopeChild(Me)
    End Sub
    Public ReadOnly Property ChildIndicator() As IndicatorBase Implements IParentIndicator.ChildIndicator
        Get
            Return Me.m_childIndicator
        End Get
    End Property
    Public Overrides Function GetProcessedValue(currentIndex As Integer) As Double
        Dim movingAverage As Double = MyBase.GetProcessedValue(currentIndex)
        Dim result As Double = movingAverage + (movingAverage * Me.Percent)
        Return result
    End Function
    Protected Overrides Sub OnAttached(parent As UIChartElement)
        MyBase.OnAttached(parent)
        Me.ChildIndicator.Attach(parent)
    End Sub
    Protected Overrides Sub OnDettached()
        MyBase.OnDettached()
        Me.ChildIndicator.Dettach()
    End Sub
    Protected Overrides Sub OnNotifyPropertyChanged(e As System.ComponentModel.PropertyChangedEventArgs)
        MyBase.OnNotifyPropertyChanged(e)
        If e.PropertyName = "DataSource" Then
            Me.m_childIndicator.DataSource = Me.DataSource
        End If
        If e.PropertyName = "CategoryMember" Then
            Me.m_childIndicator.CategoryMember = Me.CategoryMember
        End If
        If e.PropertyName = "ValueMember" Then
            Me.m_childIndicator.ValueMember = Me.ValueMember
        End If
        If e.PropertyName = "Period" Then
            Me.m_childIndicator.Period = Me.Period
        End If
        If e.PropertyName = "Percent" Then
            Me.m_childIndicator.Percent = Me.Percent
        End If
    End Sub
End Class
Now that we have the MovingAverageEnvelopeIndicator ready, let us set up some sample data and see how it looks like. The following snippet uses BindingList of custom OhlcObjects. For the sake of presentation, this example adds OhlcSeries and a simple Moving Average indicator next to the MovingAverageEnvelopeIndicator.
Create and Setup Indicator
BindingList<OhlcObject> dataSource = new BindingList<OhlcObject>();
dataSource.Add(new OhlcObject(17, 18, 12, 14, DateTime.Now));
dataSource.Add(new OhlcObject(16, 17, 11, 17, DateTime.Now.AddDays(1)));
dataSource.Add(new OhlcObject(18, 19, 12, 14, DateTime.Now.AddDays(2)));
dataSource.Add(new OhlcObject(15, 15, 12, 12, DateTime.Now.AddDays(3)));
dataSource.Add(new OhlcObject(15, 18, 15, 16, DateTime.Now.AddDays(4)));
dataSource.Add(new OhlcObject(15, 17, 11, 17, DateTime.Now.AddDays(5)));
dataSource.Add(new OhlcObject(12, 15, 12, 14, DateTime.Now.AddDays(6)));
dataSource.Add(new OhlcObject(15, 15, 12, 13, DateTime.Now.AddDays(7)));
dataSource.Add(new OhlcObject(15, 18, 15, 17, DateTime.Now.AddDays(8)));
dataSource.Add(new OhlcObject(15, 17, 11, 17, DateTime.Now.AddDays(9)));
dataSource.Add(new OhlcObject(12, 15, 12, 14, DateTime.Now.AddDays(10)));
dataSource.Add(new OhlcObject(17, 18, 12, 14, DateTime.Now.AddDays(11)));
dataSource.Add(new OhlcObject(15, 18, 15, 17, DateTime.Now.AddDays(12)));
dataSource.Add(new OhlcObject(15, 18, 15, 16, DateTime.Now.AddDays(13)));
dataSource.Add(new OhlcObject(17, 18, 12, 14, DateTime.Now.AddDays(14)));
MovingAverageIndicator maIndicator = new MovingAverageIndicator();
maIndicator.ValueMember = "Close";
maIndicator.CategoryMember = "Date";
maIndicator.DataSource = dataSource;
maIndicator.Period = 5;
maIndicator.BorderColor = Color.Red;
maIndicator.PointSize = SizeF.Empty;
this.radChartView1.Series.Add(maIndicator);
MovingAverageEnvelopeIndicator envelopeIndicator = new MovingAverageEnvelopeIndicator();
envelopeIndicator.ValueMember = "Close";
envelopeIndicator.CategoryMember = "Date";
envelopeIndicator.DataSource = dataSource;
envelopeIndicator.Period = 5;
envelopeIndicator.BorderColor = Color.Green;
envelopeIndicator.ChildIndicator.BorderColor = Color.Black;
envelopeIndicator.PointSize = SizeF.Empty;
envelopeIndicator.Percent = 0.25;
this.radChartView1.Series.Add(envelopeIndicator);
CandlestickSeries series = new CandlestickSeries();
series.OpenValueMember = "Open";
series.CloseValueMember = "Close";
series.HighValueMember = "High";
series.LowValueMember = "Low";
series.CategoryMember = "Date";
series.DataSource = dataSource;
this.radChartView1.Series.Add(series);
this.radChartView1.Axes[0].LabelFormat = "{0:dd}";
(this.radChartView1.Axes[1] as LinearAxis).Minimum = 5;
Dim dataSource As New BindingList(Of OhlcObject)()
dataSource.Add(New OhlcObject(17, 18, 12, 14, DateTime.Now))
dataSource.Add(New OhlcObject(16, 17, 11, 17, DateTime.Now.AddDays(1)))
dataSource.Add(New OhlcObject(18, 19, 12, 14, DateTime.Now.AddDays(2)))
dataSource.Add(New OhlcObject(15, 15, 12, 12, DateTime.Now.AddDays(3)))
dataSource.Add(New OhlcObject(15, 18, 15, 16, DateTime.Now.AddDays(4)))
dataSource.Add(New OhlcObject(15, 17, 11, 17, DateTime.Now.AddDays(5)))
dataSource.Add(New OhlcObject(12, 15, 12, 14, DateTime.Now.AddDays(6)))
dataSource.Add(New OhlcObject(15, 15, 12, 13, DateTime.Now.AddDays(7)))
dataSource.Add(New OhlcObject(15, 18, 15, 17, DateTime.Now.AddDays(8)))
dataSource.Add(New OhlcObject(15, 17, 11, 17, DateTime.Now.AddDays(9)))
dataSource.Add(New OhlcObject(12, 15, 12, 14, DateTime.Now.AddDays(10)))
dataSource.Add(New OhlcObject(17, 18, 12, 14, DateTime.Now.AddDays(11)))
dataSource.Add(New OhlcObject(15, 18, 15, 17, DateTime.Now.AddDays(12)))
dataSource.Add(New OhlcObject(15, 18, 15, 16, DateTime.Now.AddDays(13)))
dataSource.Add(New OhlcObject(17, 18, 12, 14, DateTime.Now.AddDays(14)))
Dim maIndicator As New MovingAverageIndicator()
maIndicator.ValueMember = "Close"
maIndicator.CategoryMember = "Date"
maIndicator.DataSource = dataSource
maIndicator.Period = 5
maIndicator.BorderColor = Color.Red
maIndicator.PointSize = SizeF.Empty
Me.RadChartView1.Series.Add(maIndicator)
Dim envelopeIndicator As New MovingAverageEnvelopeIndicator()
envelopeIndicator.ValueMember = "Close"
envelopeIndicator.CategoryMember = "Date"
envelopeIndicator.DataSource = dataSource
envelopeIndicator.Period = 5
envelopeIndicator.BorderColor = Color.Green
envelopeIndicator.ChildIndicator.BorderColor = Color.Black
envelopeIndicator.PointSize = SizeF.Empty
envelopeIndicator.Percent = 0.25
Me.RadChartView1.Series.Add(envelopeIndicator)
Dim series As New CandlestickSeries()
series.OpenValueMember = "Open"
series.CloseValueMember = "Close"
series.HighValueMember = "High"
series.LowValueMember = "Low"
series.CategoryMember = "Date"
series.DataSource = dataSource
Me.RadChartView1.Series.Add(series)
Me.RadChartView1.Axes(0).LabelFormat = "{0:dd}"
TryCast(Me.RadChartView1.Axes(1), LinearAxis).Minimum = 5