Step-By-Step Skinning Example
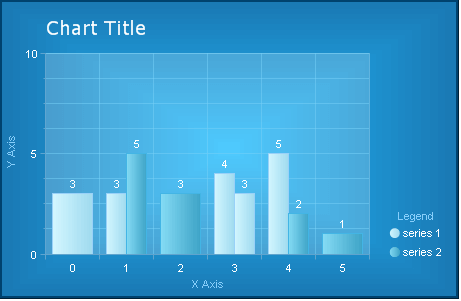
Here is a list of the steps one has to make in order to style RadChart to look like the image we used when describing the Chart elements. We start with a plain chart with no visual properties defined.
-
Styling the chart’s borders and background
- Appearance -> Appearance -> Border -> Color : 0; 66; 110
- Appearance -> Appearance -> Border -> Width : 5
- Appearance -> Appearance -> FillStyle -> FillType : Gradient
- Appearance -> Appearance -> FillStyle -> FillSettings -> GradientMode : Center
- Appearance -> Appearance -> FillStyle -> MainColor : 35; 189; 254
- Appearance -> Appearance -> FillStyle -> SecondColor : 26; 120; 179
-
Styling the title
- Elements -> ChartTitle -> Appearance -> Border -> Visible : False
- Elements -> ChartTitle -> Appearance -> FillStyle -> MainColor : None / Transparent
- Elements -> ChartTitle -> TextBlock -> Appearance -> TextProperties -> Color : White
- Elements -> ChartTitle -> TextBlock -> Appearance -> TextProperties -> Font : Verdana; 14pt
- Elements -> ChartTitle -> Appearance ->Position -> AlignedPosition : TopLeft
- Elements -> ChartTitle -> Appearance -> Dimensions -> Margins : 4%; 10px; 14px; 8%
-
Styling the legend
- Elements -> Legend -> Appearance -> FillStyle -> MainColor : None / Transparent
- Elements -> Legend -> Appearance -> Border -> Visible : False
- Elements -> Legend -> Appearance -> ItemTextAppearance -> TextProperties -> Color : White
- Elements -> Legend -> TextBlock -> Text : Legend
- Elements -> Legend -> TextBlock -> Visible : True
- Elements -> Legend -> TextBlock -> Appearance -> TextProperties -> Color : LightSkyBlue
- Elements -> Legend -> TextBlock -> Appearance -> Position -> AlignedPosition : Top
- Elements -> Legend -> Appearance -> Position -> AlignedPosition -> BottomRight
- Elements -> Legend -> Appearance -> Dimensions -> Margins : 1px; 3%; 12%; 1px
-
Styling the plot area
- Elements -> PlotArea -> Appearance -> Border -> Color : 97; 180; 223
- Elements -> PlotArea -> Appearance -> FillStyle -> MainColor : 50; 255; 255; 255
- Elements -> PlotArea -> Appearance -> Dimensions -> Margins : 18%; 90px; 15%; 10%
-
Styling the X Axis
- Elements -> PlotArea -> XAxis -> Appearance -> Color : 96; 164; 205
- Elements -> PlotArea -> XAxis -> Appearance -> MajorGridLines -> Color : 120; 209; 248
- Elements -> PlotArea -> XAxis -> Appearance -> MajorTick -> Color : 96; 164; 205
- Elements -> PlotArea -> XAxis -> Appearance -> TextAppearance -> TextProperties -> Color : White
- Elements -> PlotArea -> XAxis -> AxisLabel -> TextBlock -> Text -> X Axis
- Elements -> PlotArea -> XAxis -> AxisLabel -> TextBlock -> Appearance -> TextProperties -> Color : LightSkyBlue
- Elements -> PlotArea -> XAxis -> AxisLabel -> Appearance -> Dimensions -> Paddings : 1px; 1px; 10%; 1px
-
Styling the Y Axis
- Elements -> PlotArea -> YAxis -> Appearance -> Color : 95; 165; 208
- Elements -> PlotArea -> YAxis -> Appearance -> MajorGridLines -> Color : 120; 209; 248
- Elements -> PlotArea -> YAxis -> Appearance -> MajorTick -> Color : 95; 165; 208
- Elements -> PlotArea -> YAxis -> Appearance -> MajorGridLines -> Color : 120; 209; 248
- Elements -> PlotArea -> YAxis -> Appearance -> MinorTick -> Color : 95; 165; 208
- Elements -> PlotArea -> YAxis -> Appearance -> TextAppearance -> TextProperties -> Color : White
- Elements -> PlotArea -> YAxis -> AxisLabel -> TextBlock -> Text -> Y Axis
- Elements -> PlotArea -> YAxis -> AxisLabel -> TextBlock -> Appearance -> TextProperties -> Color : LightSkyBlue
-
Styling the data series
- Data -> Series -> Series 1 -> Appearance -> Appearance -> Border -> Color : 153; 209; 248
- Data -> Series -> Series 1 -> Appearance -> Appearance -> FillStyle -> MainColor : 213; 247; 255
- Data -> Series -> Series 1 -> Appearance -> Appearance -> FillStyle -> SecondColor : 157; 217; 238
- Data -> Series -> Series 1 -> Appearance -> Appearance -> TextAppearance -> TextProperties -> Color : White
- Data -> Series -> Series 2 -> Appearance -> Appearance -> Border -> Color : 67; 181; 229
- Data -> Series -> Series 2 -> Appearance -> Appearance -> FillStyle -> MainColor : 136; 221; 246
- Data -> Series -> Series 2 -> Appearance -> Appearance -> FillStyle -> SecondColor : 59; 161; 197
- Data -> Series -> Series 2 -> Appearance -> Appearance -> TextAppearance -> TextProperties -> Color : White