How Do I extend the Displayable Area for YAxis Data?
"My data touches the upper boundary of the plot area but that makes the data harder to see. How do I extend the viewable area along the YAxis?"
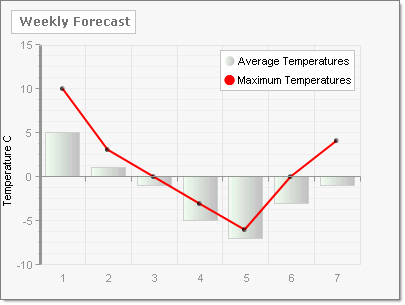
Assign the YAxis AxisMode property. By default the ChartYAxisMode property value is Normal and the YAxis data fills the available space.
myChart.PlotArea.YAxis.AxisMode = ChartYAxisMode.Normal;
CS
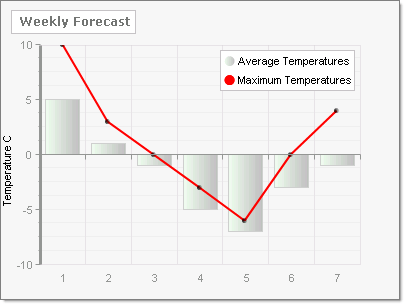
If you set the ChartYAxisMode to Extended, additional area is placed above the highest data point to make the chart easier to read.
myChart.PlotArea.YAxis.AxisMode = ChartYAxisMode.Extended;
CS