Spline Areas
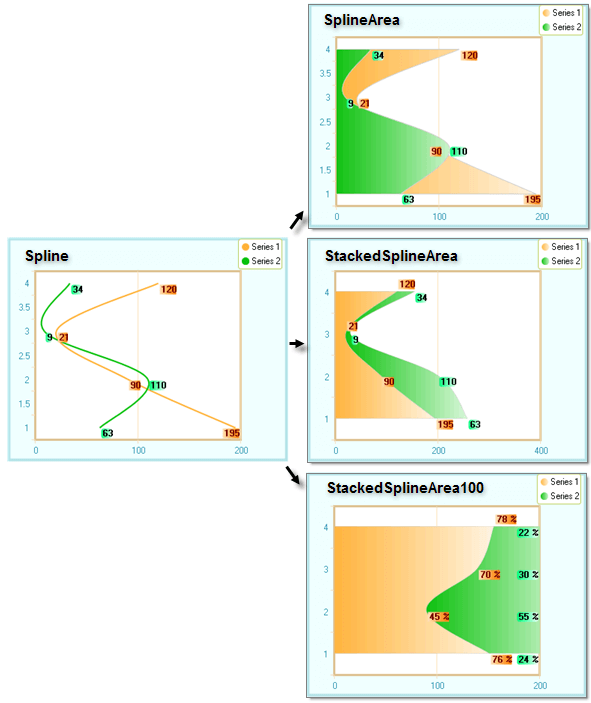
The new Spline Area Charts take the Spline chart a step further. Like the Spline, the Spline Area takes a limited set of known data points and interpolates the intervening values. Then the area defined by the spline curve is filled in. You define one or more series of chart items, set the chart type to SplineArea, SplineStackedArea or StackedSplineArea100 and RadChart does the rest.
You can see how the same data is presented using the new chart types. SplineArea displays from the back to the front, starting with the first series. StackedSplineArea adds each area to the next without covering previous areas. StackedSplineArea100 shows each area as a percentage contributing to the whole of a category.