Series Types
Chart series have two primary functions: (1) they contain a collection of specific data points representing the actual data, and (2) they visualize the data using an internal predefined model determined by the series type. RadChartView supports a number of series types – Bar, Line (Spline), Area (Spline Area), Scatter, Stock, Pie, Donut, Polar, Radar – and each of them can be used only with a certain area type - Categorical, Pie or Polar. The following schema shows the set of series supported by each area type:
- Cartesian Area: Supports Bar, Line, Area, Ohlc, Candlestick and Scatter series. This area sets a standard Cartesian coordinate system where the position of each point on the plane is identified through a pair of values. Series supported in RadChartView’s Cartesian area can be classified in two groups – scatter and categorical. While the former positions its point using two numerical values and, therefore, requires two numerical axes, the latter uses one numerical and one categorical value to plot its data points. The Categorical series you will be able to use with RadChartView are Bar, Line (Spline), Area (Spline Area), Ohlc, Candlestick. Currently the control supports only Scatter point series.
The CartesianSeries also defines the ClipLabels property which is by default set to false. This property determines whether the series labels will be clipped according to the viewport`s width and height.
Pie Area: Supports Pie, Donut series. Unlike all other areas, Pie area does not use axes. It displays each data point as slices with arc size directly proportional to the magnitude of the raw data point’s value. The supported series types are Pie and Donut.
Polar Area: Supports Polar (Point, Line, Area) and Radar (Point, Line, Area) series. This area setups a polar coordinate system, where each value is positioned using a value-angle couple. Additionally, the Polar area renders Radar series, which splits the polar area into equal-size category sectors.
Funnel Area: Supports FunnelSeries. Funnel area doesn't use an axis as well. It displays a single series of data in progressively decreasing or increasing proportions, organized in segments, where each segment represents the value for the particular item from the series. The items' values can also influence the height and the shape of the corresponding segments.
Each series type contains a DataPoints collection that contains specific data points. For example, Bar, Line and Area series work with CategoricalDataPoints. Scatter and Pie series, however, operate only with ScatterDataPoints and PieDataPoints respectively. Each series type visualizes the data in the best way to present the information stored in its data points. The screenshots below illustrate how each series type is rendered:
Figure 1: Series Types
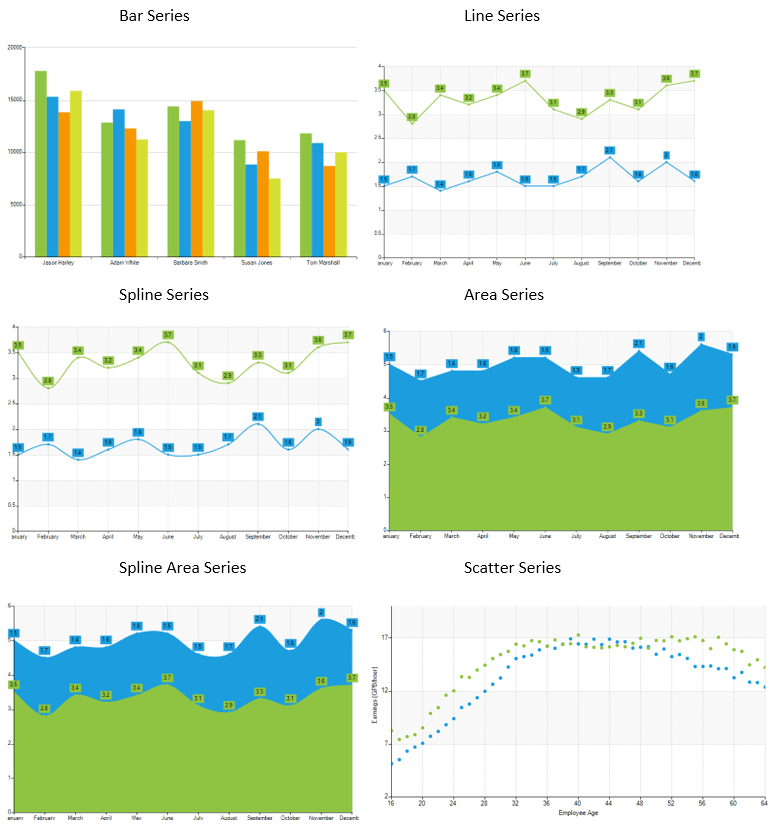
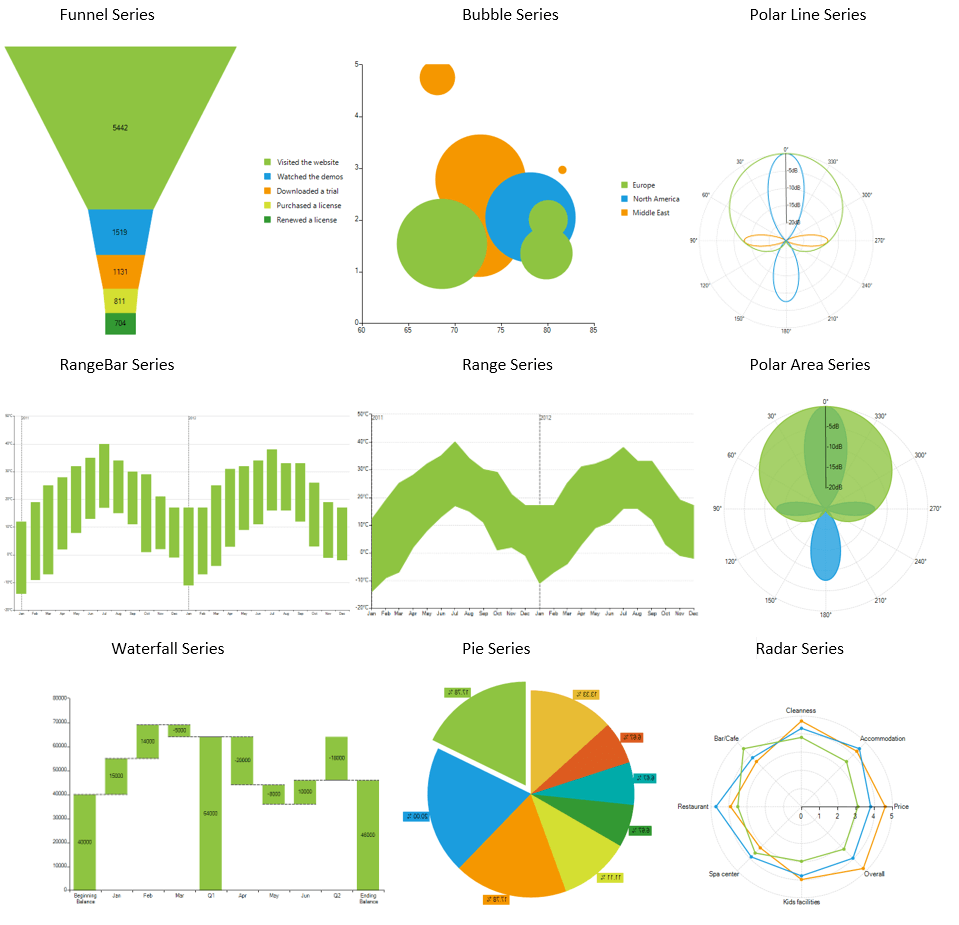
Chart series support both bound and unbound mode. All series contain the following two binding properties - DataSource and ValueMember. Once a DataSource is assigned, the ValueMember property is used to resolve the property of the data records visualized by the data points. Different series types introduce additional data binding properties, related to the specific of the contained data. These are CategoricalMember, AngleMember, XValueMember, YValueMember. In unbound mode, categorical series can be populated with data manually using the DataPoints collection.
A common scenario for RadChartView is to contain several series instances, which could be of different types. For example, you can easily combine derivatives of CategoricalSeries class.
The chart series also have a mechanism for combining data points that reside in different series but have the same category. This mechanism is controlled via the CombineMode property. The combine mode can be None, Cluster and Stack.
None: The series will be plotted independently of each other.
Cluster: The data points will be in the same category huddled close together.
Stack: Plots the points on top of each other.
Stack100: Presents the values of one series as a percentage of the other series.