Debugging Tests
JustMock comes with built-in Debug View (API) and Debug Window that are really useful when it comes to debugging tests and finding where the unexpected behavior comes from. This article covers the available functionalities and gives some good practices about where and what to look for in order to check the correctness of a certain test.
Debug Window
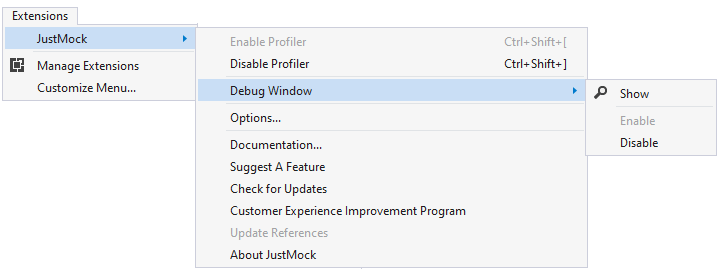
JustMock extension for Visual Studio 2017 (and above) makes mock debugging even more convenient by adding tool window for visualizing trace messages and arranged method mocks. It can be opened from main menu View > Other Windows > JustMock Debug Window or extension menu - JustMock > Debug Window > Show. There is also an option to enable or disable debug window by using the corresponding command in the extension menu.
Important
Enabling or disabling the debug window will be persisted and will be applied not only on the current instance of Visual Studio but also on all future ones.
The debug window consist of two panes which are active only while debugging:
-
Debug Trace
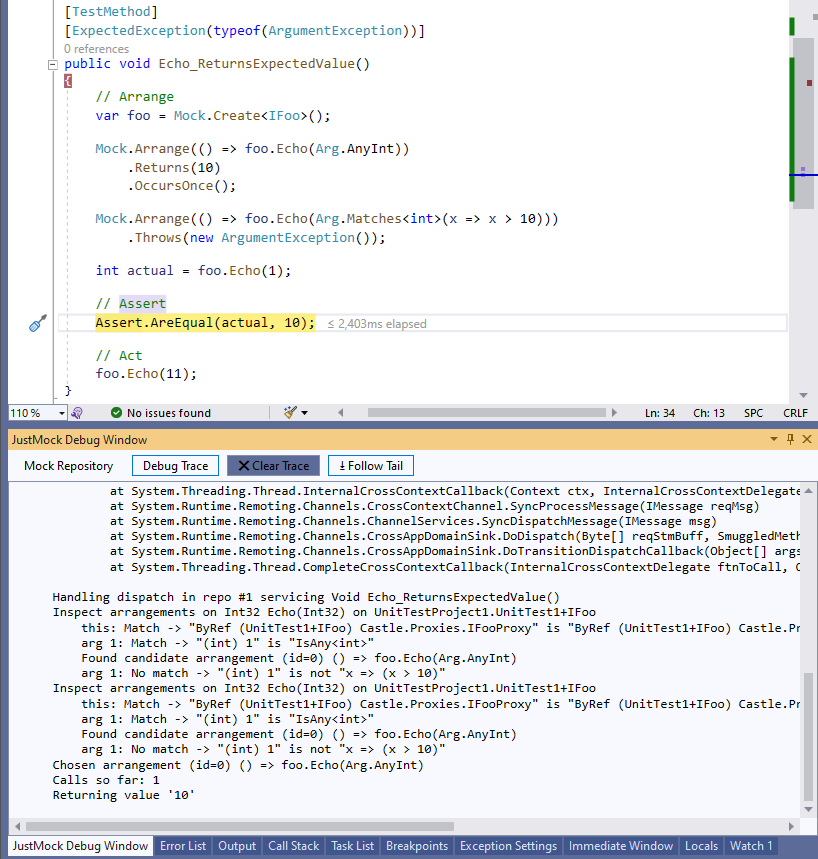
This pane shows information about all the intercepted invocations in the test method. A sample output produced by sample unit test looks as following:
-
Mock Repository
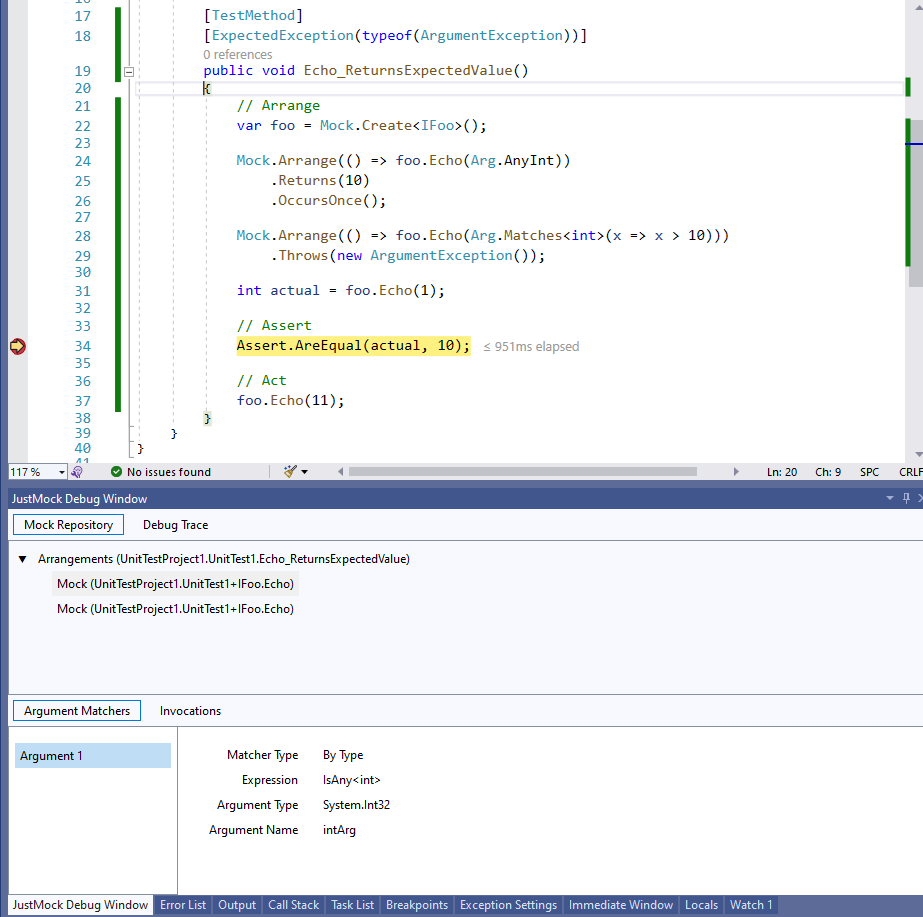
The pane shows basic information about particular method mock like name, declaring type and its invocations. The test method sample has the following repository view:
Debug View
Debug View is an API that can be used only while debugging your test methods to provide you with more information about their execution. To enable it, place a breakpoint at the start of the inspected test and run the debugger. When the breakpoint is hit, open the Watch window and add the Debug View by writing: DebugView.[property_name] under the Name column. The properties you can use are:
- CurrentState
- FullTrace
- IsTraceEnabled
- LastTrace
At first the fields will be empty. The information in them will be populated step by step, while debugging the test method.

Inspecting the Current State
The CurrentState field lists all of the arrangements that have been made during the test execution, all of the invocations and the elevated mocking state. This field will be updated accordingly after every new arrangement or invocation in the test method. You can use the text visualizer to inspect the CurrentState as shown below:
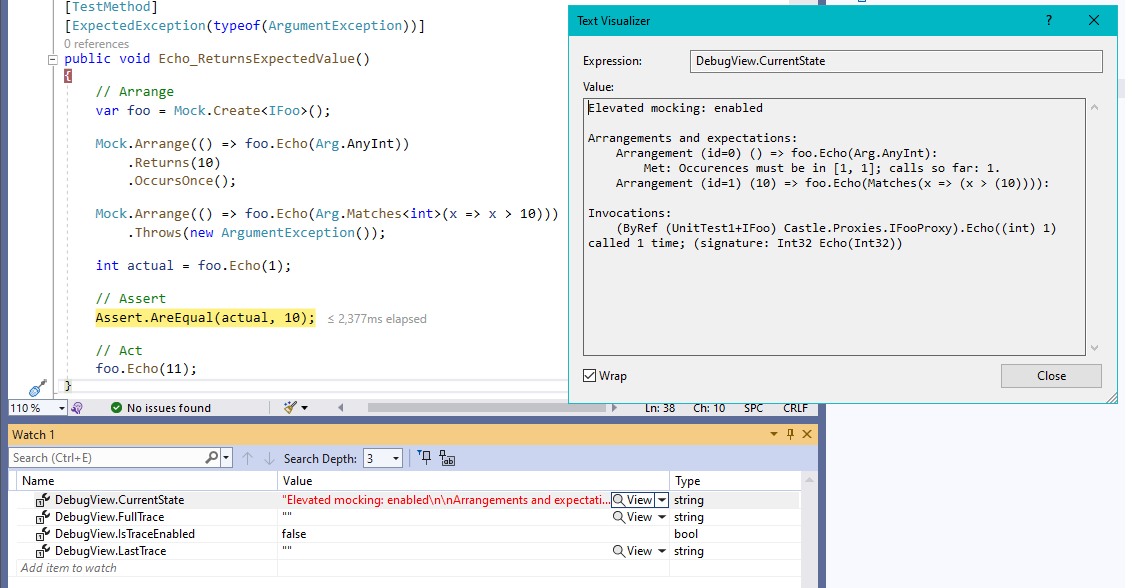
In the Text Visualizer you will be able to see:
- Elevated mocking - Enabled or disabled depending if the JustMock profiler is turned on or off.
- Arrangements and expectations - Here you will find full list of all the arrangements made so far along with their expectations.
- Invocations - Shows all invocations with their arguments types and values. Another thing you can see is how many times certain invocation has been executed.
Tracing the Test Execution
Tracing your test method gives more details about the intercepted invocations order. The JustMock Debug View gathers information about all intercepted calls. It shows their stack traces, matching arguments, the chosen arrangement, calls made so far and the return value (for functions). In addition, when tracing is enabled, the debugger prints the tracing log in the Output window.
To enable the tracing mode inside the Debug View, you must set the IsTraceEnabled field to true at the beginning of the test method. This can be achieved by putting a breakpoint there and editing the value inside the Watch window.

Another option is to add: DebugView.IsTraceEnabled = true; as a first line of the test method. This will automatically enable the tracing option in debug mode.
[C#] Enable tracing in code
    [TestMethod]
    public void Echo_ReturnsExpectedValue()
    {
        DebugView.IsTraceEnabled = true;

        //Arrange
        var foo = Mock.Create<IFoo>();

        Mock.Arrange(() => foo.Echo(Arg.AnyInt)).Returns(10);

        int actual = foo.Echo(1);

        //Assert
        Assert.AreEqual(actual, 10);
    }
While tracing, you can operate with the rest two fields from the Debug View:
- FullTrace - Gives information about all the intercepted invocations in the test method.
- LastTrace - Gives information only about the last intercepted invocation in the test execution.
Once again, you can use the text visualizer to inspect the information in the fields:
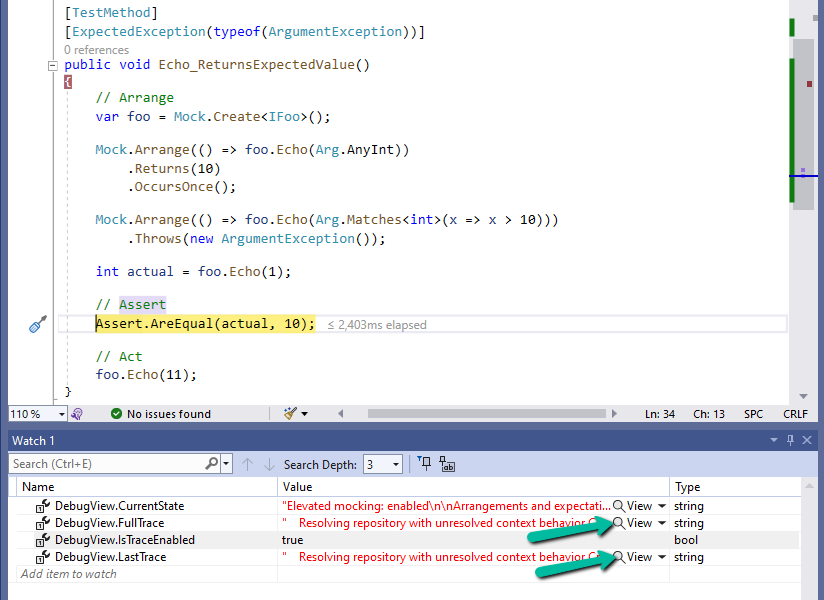
In the text visualizer you will be able to see the following information about each intercepted call:
- Stack trace - The full stack trace of the invocation.
- Matching arrangements on the particular call - All arrangements made for that member.
- Chosen arrangement - The applied arrangement in the test method.
- Number of calls - The number of calls made to that member.
- Return value (for functions only) - The return value of the function.
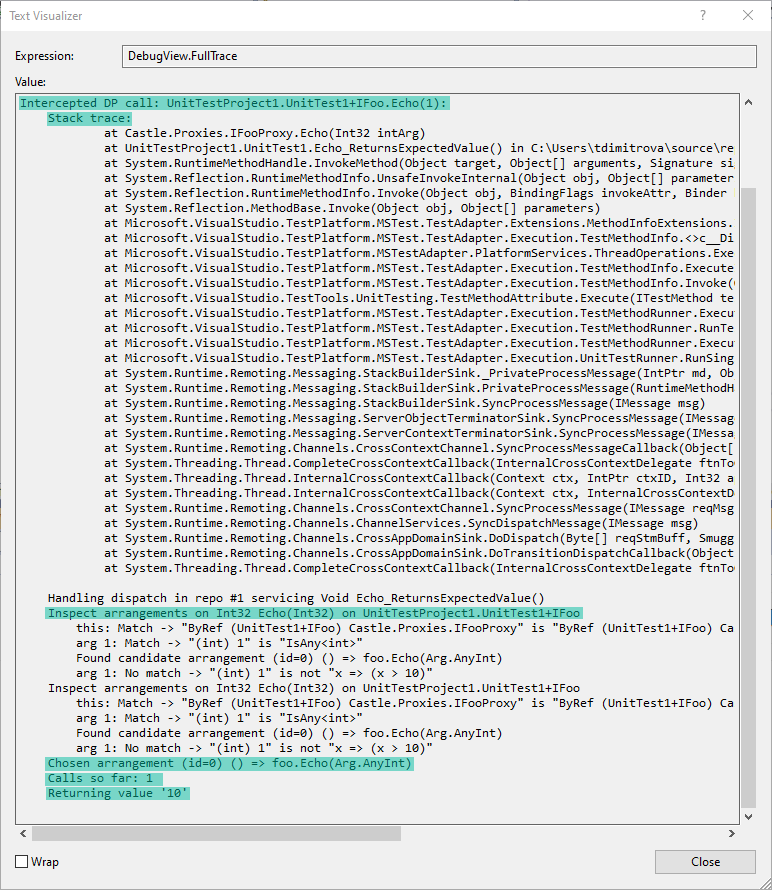
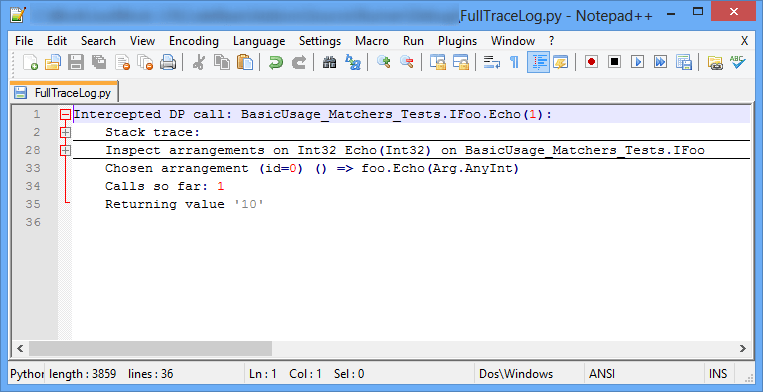
As the logs can be rather long, you can copy them from the Visual Studio's Text Visualizer and paste them in another source code editor (Notepad++ for example). Then, changing the language to Python will provide the possibility of collapsing or expanding certain groups inside the log. Further, you will also get an appropriate syntax highlighting:
