Sparkline Chart
A Sparkline is a very small chart, as part of the ASP NET AJAX Chart, drawn without axes, coordinates, legend, title and other chart-specific elements. Sparklines behave like inline elements (rendered inside spans) as opposed to standard HtmlCharts, which behave like block elements(rendered inside divs) so that they can be easily embedded in text. In this Help article, you’ll learn which type series can be rendered as a Sparkline chart,what common properties you might set to use a Sparkline, and see example code (Example 1) to see how to create the Sparkline shown in Figure 1.
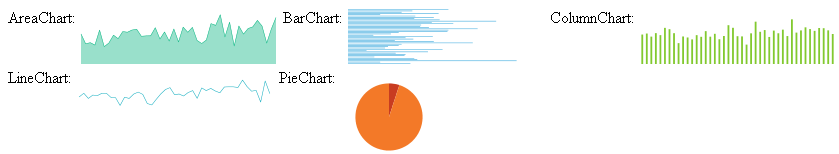
Several examples of Sparklines.
In order to create a Sparkline chart, you must create a regular instance of RadHtmlChart and set its Layout property to "Sparkline". You can read the list below to see the common properties you’ll set with Sparklines.
You can explicitly change the visibility of the hidden elements like axes, legend, title, etc., by setting the Visible property of the particular element to true (e.g., see the PieCharts Sparklines definition below).
A Sparkline’s default width is based upon the number of the SeriesItems (the exception is PieSeries, whose width is equal to its default height).
-
Different browsers have a different default height for Sparklines, which varies between 18 pixels and 20 pixels:
- FireFox and Chrome: 20 pixels
- Internet Explorer 10 and 9: 18 pixels
- Internet Explorer 8 and 7: 19 pixels
The BarSeries type is stacked by default. You can unstack the series by explicitly setting the Stack property of the first series to false.
Sparklines will display a single tooltip for every category, called a shared tooltip that consists of information about the category,the series' names and the corresponding values. You can reset the standard behavior of the tooltips by setting the Shared property of the CommonTooltipsAppearance element to false.
Making a Series Work as Sparklines
You can use any of these types of series as Sparklines:
Example 1: How to create a Sparkline using different series types.
AreaChart:
<telerik:RadHtmlChart ID="RainfallChart" runat="server" Layout="Sparkline" Width="200px" Height="60px">
    <PlotArea>
        <Series>
            <telerik:AreaSeries DataFieldY="RainfallData">
                <Appearance FillStyle-BackgroundColor="#00b37d"></Appearance>
                <TooltipsAppearance Color="White" />
            </telerik:AreaSeries>
        </Series>
    </PlotArea>
</telerik:RadHtmlChart>

BarChart:
<telerik:RadHtmlChart ID="AirFrostChart" runat="server" Layout="Sparkline" Width="200px" Height="60px">
    <PlotArea>
        <Series>
            <telerik:BarSeries DataFieldY="AirFrostData">
                <Appearance FillStyle-BackgroundColor="#25a0da"></Appearance>
                <TooltipsAppearance Color="White" />
            </telerik:BarSeries>
        </Series>
    </PlotArea>
</telerik:RadHtmlChart>

ColumnChart:
<telerik:RadHtmlChart ID="SunshineChart" runat="server" Layout="Sparkline" Width="200px" Height="60px">
    <PlotArea>
        <Series>
            <telerik:ColumnSeries DataFieldY="SunshineData">
                <Appearance FillStyle-BackgroundColor="#82c92f"></Appearance>
                <TooltipsAppearance Color="White" />
            </telerik:ColumnSeries>
        </Series>
    </PlotArea>
</telerik:RadHtmlChart>
<br />

LineChart:
<telerik:RadHtmlChart ID="MeanTempChart" runat="server" Layout="Sparkline" Width="200px" Height="60px">
    <PlotArea>
        <Series>
            <telerik:LineSeries DataFieldY="MeanTempData">
                <Appearance FillStyle-BackgroundColor="#07a9bc"></Appearance>
                <TooltipsAppearance Color="White" />
            </telerik:LineSeries>
        </Series>
    </PlotArea>
</telerik:RadHtmlChart>

PieChart:
<telerik:RadHtmlChart ID="WinterChart" runat="server" Layout="Sparkline" Width="100px" Height="100px">
    <PlotArea>
        <Series>
            <telerik:PieSeries>
                <TooltipsAppearance Color="White" />
                <SeriesItems>
                    <telerik:PieSeriesItem Y="5" BackgroundColor="#c83c21" />
                    <telerik:PieSeriesItem Y="95" BackgroundColor="#f37928" />
                </SeriesItems>
            </telerik:PieSeries>
        </Series>
    </PlotArea>
</telerik:RadHtmlChart>
protected void Page_Load(object sender, EventArgs e)
{
    MeanTempChart.DataSource = GetData();
    MeanTempChart.DataBind();

    SunshineChart.DataSource = GetData();
    SunshineChart.DataBind();

    RainfallChart.DataSource = GetData();
    RainfallChart.DataBind();

    AirFrostChart.DataSource = GetData();
    AirFrostChart.DataBind();
}

protected DataTable GetData()
{
    DataTable dt = new DataTable();
    dt.Columns.Add("Year");
    dt.Columns.Add("MeanTempData");
    dt.Columns.Add("SunshineData");
    dt.Columns.Add("RainfallData");
    dt.Columns.Add("AirFrostData");

    dt.Rows.Add(1970, 8.95, 260.7, 323.4, 10.3);
    dt.Rows.Add(1971, 9.47, 266.2, 233.8, 6.6);
    dt.Rows.Add(1972, 8.72, 249.3, 244, 5.5);
    dt.Rows.Add(1973, 9.21, 268.4, 222.1, 9.3);
    dt.Rows.Add(1974, 9.13, 257.6, 358, 3.3);
    dt.Rows.Add(1975, 9.47, 297.1, 208, 6.9);
    dt.Rows.Add(1976, 9.46, 289.9, 240.8, 8.8);
    dt.Rows.Add(1977, 8.86, 268, 312.4, 6.8);
    dt.Rows.Add(1978, 8.83, 213.7, 279.8, 9.4);
    dt.Rows.Add(1979, 7.7, 250, 345.2, 15.2);
    dt.Rows.Add(1980, 8.9, 244.9, 339.2, 8.6);
    dt.Rows.Add(1981, 8.72, 234.2, 358.9, 10.8);
    dt.Rows.Add(1982, 9.35, 257.5, 365.4, 7.5);
    dt.Rows.Add(1983, 9.64, 248.4, 302.2, 7.4);
    dt.Rows.Add(1984, 9.31, 279.2, 305.9, 8.3);
    dt.Rows.Add(1985, 7.98, 249.1, 306.8, 13.3);
    dt.Rows.Add(1986, 7.77, 264.6, 380.1, 10.3);
    dt.Rows.Add(1987, 8.61, 234.8, 277.1, 10.2);
    dt.Rows.Add(1988, 9.39, 252.6, 341.5, 5.2);
    dt.Rows.Add(1989, 10.01, 311.8, 258.3, 4.4);
    dt.Rows.Add(1990, 10.29, 297.3, 368.5, 2.6);
    dt.Rows.Add(1991, 9.27, 251.6, 250.5, 8.7);
    dt.Rows.Add(1992, 9.36, 250.6, 385.3, 5.9);
    dt.Rows.Add(1993, 9.07, 205.7, 338.3, 6.7);
    dt.Rows.Add(1994, 9.57, 267.2, 383.1, 4.8);
    dt.Rows.Add(1995, 9.86, 330.8, 264.1, 8.8);
    dt.Rows.Add(1996, 8.73, 275.7, 236.2, 12.8);
    dt.Rows.Add(1997, 10.25, 285.2, 268.1, 5.5);
    dt.Rows.Add(1998, 9.86, 247.7, 417, 5.2);
    dt.Rows.Add(1999, 10.18, 282, 400.6, 4.1);
    dt.Rows.Add(2000, 9.8, 267.7, 497.8, 3.8);
    dt.Rows.Add(2001, 9.54, 287.2, 295.6, 9.7);
    dt.Rows.Add(2002, 10.38, 252.3, 430.4, 1.9);
    dt.Rows.Add(2003, 10.41, 343.6, 214, 8.2);
    dt.Rows.Add(2004, 10.4, 271.3, 395.6, 4.9);
    dt.Rows.Add(2005, 10.32, 283.4, 321.5, 5.9);
    dt.Rows.Add(2006, 11.39, 299.9, 372.9, 5.8);
    dt.Rows.Add(2007, 10.44, 290.6, 387.7, 2.7);
    dt.Rows.Add(2008, 9.77, 280.7, 446.4, 6.8);
    dt.Rows.Add(2009, 9.89, 296.2, 394.2, 7.1);
    dt.Rows.Add(2010, 8.19, 295.3, 239.8, 17.3);
    dt.Rows.Add(2011, 11.26, 283.8, 368.4, 3.3);
    dt.Rows.Add(2012, 9.46, 263.8, 473.1, 6.4);

    return dt;
}
Protected Sub Page_Load(sender As Object, e As EventArgs) Handles Me.Load
    MeanTempChart.DataSource = GetData()
    MeanTempChart.DataBind()

    SunshineChart.DataSource = GetData()
    SunshineChart.DataBind()

    RainfallChart.DataSource = GetData()
    RainfallChart.DataBind()

    AirFrostChart.DataSource = GetData()
    AirFrostChart.DataBind()
End Sub

Protected Function GetData() As DataTable
    Dim dt As New DataTable()
    dt.Columns.Add("Year")
    dt.Columns.Add("MeanTempData")
    dt.Columns.Add("SunshineData")
    dt.Columns.Add("RainfallData")
    dt.Columns.Add("AirFrostData")

    dt.Rows.Add(1970, 8.95, 260.7, 323.4, 10.3)
    dt.Rows.Add(1971, 9.47, 266.2, 233.8, 6.6)
    dt.Rows.Add(1972, 8.72, 249.3, 244, 5.5)
    dt.Rows.Add(1973, 9.21, 268.4, 222.1, 9.3)
    dt.Rows.Add(1974, 9.13, 257.6, 358, 3.3)
    dt.Rows.Add(1975, 9.47, 297.1, 208, 6.9)
    dt.Rows.Add(1976, 9.46, 289.9, 240.8, 8.8)
    dt.Rows.Add(1977, 8.86, 268, 312.4, 6.8)
    dt.Rows.Add(1978, 8.83, 213.7, 279.8, 9.4)
    dt.Rows.Add(1979, 7.7, 250, 345.2, 15.2)
    dt.Rows.Add(1980, 8.9, 244.9, 339.2, 8.6)
    dt.Rows.Add(1981, 8.72, 234.2, 358.9, 10.8)
    dt.Rows.Add(1982, 9.35, 257.5, 365.4, 7.5)
    dt.Rows.Add(1983, 9.64, 248.4, 302.2, 7.4)
    dt.Rows.Add(1984, 9.31, 279.2, 305.9, 8.3)
    dt.Rows.Add(1985, 7.98, 249.1, 306.8, 13.3)
    dt.Rows.Add(1986, 7.77, 264.6, 380.1, 10.3)
    dt.Rows.Add(1987, 8.61, 234.8, 277.1, 10.2)
    dt.Rows.Add(1988, 9.39, 252.6, 341.5, 5.2)
    dt.Rows.Add(1989, 10.01, 311.8, 258.3, 4.4)
    dt.Rows.Add(1990, 10.29, 297.3, 368.5, 2.6)
    dt.Rows.Add(1991, 9.27, 251.6, 250.5, 8.7)
    dt.Rows.Add(1992, 9.36, 250.6, 385.3, 5.9)
    dt.Rows.Add(1993, 9.07, 205.7, 338.3, 6.7)
    dt.Rows.Add(1994, 9.57, 267.2, 383.1, 4.8)
    dt.Rows.Add(1995, 9.86, 330.8, 264.1, 8.8)
    dt.Rows.Add(1996, 8.73, 275.7, 236.2, 12.8)
    dt.Rows.Add(1997, 10.25, 285.2, 268.1, 5.5)
    dt.Rows.Add(1998, 9.86, 247.7, 417, 5.2)
    dt.Rows.Add(1999, 10.18, 282, 400.6, 4.1)
    dt.Rows.Add(2000, 9.8, 267.7, 497.8, 3.8)
    dt.Rows.Add(2001, 9.54, 287.2, 295.6, 9.7)
    dt.Rows.Add(2002, 10.38, 252.3, 430.4, 1.9)
    dt.Rows.Add(2003, 10.41, 343.6, 214, 8.2)
    dt.Rows.Add(2004, 10.4, 271.3, 395.6, 4.9)
    dt.Rows.Add(2005, 10.32, 283.4, 321.5, 5.9)
    dt.Rows.Add(2006, 11.39, 299.9, 372.9, 5.8)
    dt.Rows.Add(2007, 10.44, 290.6, 387.7, 2.7)
    dt.Rows.Add(2008, 9.77, 280.7, 446.4, 6.8)
    dt.Rows.Add(2009, 9.89, 296.2, 394.2, 7.1)
    dt.Rows.Add(2010, 8.19, 295.3, 239.8, 17.3)
    dt.Rows.Add(2011, 11.26, 283.8, 368.4, 3.3)
    dt.Rows.Add(2012, 9.46, 263.8, 473.1, 6.4)

    Return dt
End Function
Sparkline charts are intended to be small inline elements. If you need a responsive chart, you can hide some of the elements of the
Defaultlayout. See Example 2.
Example 3: Responsive chart that looks like a sparkline chart
<style type="text/css">
    html, body, form
    {
        height: 100%;
        margin: 0;
        padding: 0;
    }
</style>
<telerik:RadHtmlChart runat="server" Width="100%" Height="100%" ID="RadHtmlChart1">
    <Legend>
        <Appearance Visible="false"></Appearance>
    </Legend>
    <PlotArea>
        <XAxis Visible="false">
            <MajorGridLines Visible="false" />
            <MinorGridLines Visible="false" />
        </XAxis>
        <YAxis Visible="false">
            <MajorGridLines Visible="false" />
            <MinorGridLines Visible="false" />
        </YAxis>
        <Series>
            <telerik:ColumnSeries>
                <SeriesItems>
                    <telerik:CategorySeriesItem Y="1" />
                    <telerik:CategorySeriesItem Y="2" />
                    <telerik:CategorySeriesItem Y="3" />
                </SeriesItems>
            </telerik:ColumnSeries>
        </Series>
    </PlotArea>
</telerik:RadHtmlChart>
<script type="text/javascript">
    window.onresize = function () {
        $find("<%=RadHtmlChart1.ClientID%>").get_kendoWidget().resize();
    }
</script>