Horizontal Waterfall Chart
A Horizontal Waterfall chart, as part of the ASP NET AJAX Chart, (a.k.a., flying bricks, bridge, etc.) shows the cumulative effect of positive or negative values on the starting point. Its purpose is to provide a better understanding of how an initial amount is influenced by subsequently added positive or negative values. Generally, the first and last items of a Horizontal Waterfall series are denoted by whole columns while items in the middle are shown as floating columns. You can, however, control whether the last and middle items display the current value (e.g., a floating column set through the Y property) or the sum of all previous values (e.g., a whole column set through the Summary property).
A Horizontal Waterfall chart is useful for different types of quantitative analysis related to inventory, cash flows, performance, etc. This chart type looks like a Range Bar chart where the low or high value of a subsequent item is connected to the preceding one with a thin line.
The sample in Figure 1 (which is generated by the code in Example 1) shows a break down of an income statement. For example, such a chart could easily let a financial manager detect any expenses discrepancy.
Figure 1: A basic Horizontal Waterfall chart. Example 1 shows the markup used to create it.
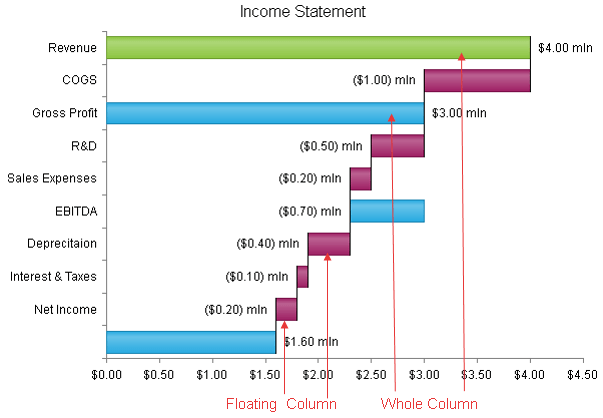
The y-axis is placed horizontally in this chart type, as this is where the item values must be positioned, whereas the x-axis that holds the items themselves is vertical because this is where the base of the bars is.
Customizing a Horizontal Waterfall Chart
The following list shows the most common areas and elements of the Horizontal Waterfall chart that you can modify. To explore the full list of options, start from the Visual Structure of the RadHtmlChart Control’s Tag Hierarchy help article.
The fill color of each series is controlled via the BackgroundColor property of the HorizontalWaterfallSeries > Appearance > FillStyle inner tag.
The name that is shown in the legend is set via the
Nameproperty of the series. You can hide the series from the legend either by omitting it, or by setting theVisibleInLegendproperty tofalse.-
The position of each item on the y-axis is controlled by its Y property of the WaterfallSeriesItem. You can also display:
The sum of all previous points since the last "RunningTotal" summary point by setting the Summary property to RunningTotal.
The sum of all previous points by setting the Summary property to Total.
Each WaterfallSeriesItem is placed with regard to one AxisItem on the x-axis.
Each item can have a label and a tooltip that follow the common pattern defined in the DataFormatString property of the LabelsAppearance and TooltipsAppearance sections of the series. The format string uses the Y / Summary of the item. You can create more complex content via the ClientTemplate of the tooltips and labels.
-
The axes are also fully customizable—the y-axis automatically adjusts the scale to accommodate the data that comes in and for finer tuning there are numerous properties that can change each aspect:
Directly in the axis tag you can use the tag's properties to control color, major and minor tick types and sizes, minimal and maximal values for the y-axis (plus a step size) whereas the x-axis requires a set of items to match the number of WaterfallSeriesItem the series have. This tag is also the place where the crossing value with the other axis can be set (the index of an item for an item axis) and whether the axis will be reversed.
The inner tags of the axis tag can control the major and minor grid lines in terms of color and size and the labels can have a DataFormatString, position and visibility set through each inner tag's properties.
The title, background colors and legend are controlled via the inner properties of the RadHtmlChart control and are common for all charts. You can find more information in the Server-side API and in the Element structure articles.
Not all properties are necessary. The RadHtmlChart will match the axes to the values if you do not declare explicit values, steps and tick properties (although the Items for axes that need them are necessary).
The Example that Creates Figure 1
Example 1: The code that creates the chart from Figure 1. It shows tasks completion of a project.
<telerik:RadHtmlChart ID="RadHtmlChart1" runat="server" Width="600px" Height="400px">
    <PlotArea>
        <Series>
            <telerik:HorizontalWaterfallSeries>
                <SeriesItems>
                    <telerik:WaterfallSeriesItem Y="4" />
                    <telerik:WaterfallSeriesItem Y="-1" BackgroundColor="#9e1f63" />
                    <telerik:WaterfallSeriesItem Summary="RunningTotal" BackgroundColor="#26a9e0" />
                    <telerik:WaterfallSeriesItem Y="-0.5" BackgroundColor="#9e1f63" />
                    <telerik:WaterfallSeriesItem Y="-0.2" BackgroundColor="#9e1f63" />
                    <telerik:WaterfallSeriesItem Summary="RunningTotal" BackgroundColor="#26a9e0" />
                    <telerik:WaterfallSeriesItem Y="-0.4" BackgroundColor="#9e1f63" />
                    <telerik:WaterfallSeriesItem Y="-0.1" BackgroundColor="#9e1f63" />
                    <telerik:WaterfallSeriesItem Y="-0.2" BackgroundColor="#9e1f63" />
                    <telerik:WaterfallSeriesItem Summary="Total" BackgroundColor="#26a9e0" />
                </SeriesItems>
                <Appearance FillStyle-BackgroundColor="#8bc53f"></Appearance>
                <LabelsAppearance Visible="true" DataFormatString="{0:C2} mln"></LabelsAppearance>
                <TooltipsAppearance Visible="false"></TooltipsAppearance>
            </telerik:HorizontalWaterfallSeries>
        </Series>
        <XAxis>
            <Items>
                <telerik:AxisItem LabelText="Revenue" />
                <telerik:AxisItem LabelText="COGS" />
                <telerik:AxisItem LabelText="Gross Profit" />
                <telerik:AxisItem LabelText="R&D" />
                <telerik:AxisItem LabelText="Sales Expenses" />
                <telerik:AxisItem LabelText="EBITDA" />
                <telerik:AxisItem LabelText="Deprecitaion" />
                <telerik:AxisItem LabelText="Interest & Taxes" />
                <telerik:AxisItem LabelText="Net Income" />
            </Items>
            <MajorGridLines Visible="false" />
            <MinorGridLines Visible="false" />
        </XAxis>
        <YAxis>
            <LabelsAppearance DataFormatString="{0:C2}"></LabelsAppearance>
            <MajorGridLines Visible="false" />
            <MinorGridLines Visible="false" />
        </YAxis>
    </PlotArea>
    <ChartTitle Text="Income Statement"></ChartTitle>
</telerik:RadHtmlChart>