Important Changes Regarding Data Binding DateTime Parsable String Fields
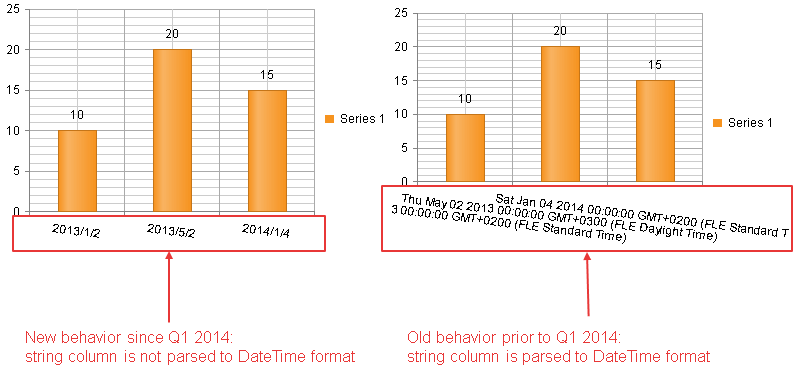
As of the Q1 2014 release, the ASP NET AJAX Chart takes into account the type of the columns from the data source that are bound to the chart. This means if the chart's category x-axis refers to a string type column from the data source that can be parsed to a DateTime format, it will be handled as a string and the labeled displayed will not be parsed.
The old and the new behavior of the control is illustrated with the code from Example 1 and is shown in Figure 1.
Figure 1: String columns from the data source that can be parsed to a DateTime format will be displayed as strings.
Example1: Data binding a DataTable data source that contains a string column that can be parsed to a DateTime format.
<telerik:RadHtmlChart runat="server" ID="RadHtmlChart1" Width="400" Height="250">
    <PlotArea>
        <Series>
            <telerik:ColumnSeries DataFieldY="yValues" Name="Series 1">
            </telerik:ColumnSeries>
        </Series>
        <XAxis DataLabelsField="dateValues" Type="category">
            <LabelsAppearance RotationAngle="7"></LabelsAppearance>
        </XAxis>
    </PlotArea>
</telerik:RadHtmlChart>
protected void Page_Load(object sender, EventArgs e)
{
    RadHtmlChart1.DataSource = GetData();
    RadHtmlChart1.DataBind();
}

protected DataTable GetData()
{
    DataTable dt = new DataTable();
    dt.Columns.Add(new DataColumn("yValues", typeof(int)));
    dt.Columns.Add(new DataColumn("dateValues", typeof(string)));

    dt.Rows.Add(new object[] { 10, "2013/1/2" });
    dt.Rows.Add(new object[] { 20, "2013/5/2" });
    dt.Rows.Add(new object[] { 15, "2014/1/4" });

    return dt;
}
Protected Sub Page_Load(sender As Object, e As EventArgs)
    RadHtmlChart1.DataSource = GetData()
    RadHtmlChart1.DataBind()
End Sub

Protected Function GetData() As DataTable
    Dim dt As New DataTable()
    dt.Columns.Add(New DataColumn("yValues", GetType(Integer)))
    dt.Columns.Add(New DataColumn("dateValues", GetType(String)))

    dt.Rows.Add(New Object() {10, "2013/1/2"})
    dt.Rows.Add(New Object() {20, "2013/5/2"})
    dt.Rows.Add(New Object() {15, "2014/1/4"})

    Return dt
End Function