Important Changes Regarding Series Declaration
The programmatic creation of series items in the ASP NET AJAX Chart control should be done via the SeriesItems collection. Telerik made the Items collection obsolete with the Q2 2013 release.
Along with these changes, the respective series item object for each series type must be used. The corresponding series items for each series type are listed in Table 1.
Table 1: List of series item objects for the corresponding series types.
| Series type | Series item |
|---|---|
| Candlestick | telerik:CandlestickSeriesItem |
| Bar, Column, Area, Line | telerik:CategorySeriesItem |
| Scatter, ScatterLine | telerik:ScatterSeriesItem |
| Bubble | telerik:BubbleSeriesItem |
| Pie, Donut | telerik:PieSeriesItem |
XValue, YValue, SizeValue and ToolTipValue properties of the SeriesItem (now CategorySeriesItem, PieSeriesItem, ScatterSeriesItem or BubbleSeriesItem) have been renamed respectively to X, Y, Size and ToolTip.
In order to access the properties of the series in the code behind, the series should be converted explicitly to the respective series type.
Casting the first series to theAreaSeries class:
C#
(RadHtmlChart1.PlotArea.Series[0] as AreaSeries).SeriesItems[0].Y = 10;VB
(RadHtmlChart1.PlotArea.Series[0] as AreaSeries).SeriesItems[0].Y = 10
How to Configure Chart Series
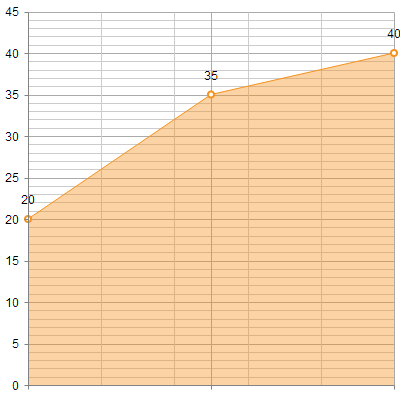
You can find an example of how to configure a simple Area chart with the SeriesItems collection in the markup and the code behind in Example 1. The output from either setup can be seen in Figure 1.
Figure 1: This chart can be rendered with the setup from Example 1 or Example 2.
Example 1: Creation of the Area chart with the SeriesItems collection in the markup.
<telerik:radhtmlchart runat="server" id="Chart1" width="400">
    <PlotArea>
        <Series>
            <telerik:AreaSeries>
                <SeriesItems>
                    <telerik:CategorySeriesItem Y="20" />
                    <telerik:CategorySeriesItem Y="35" />
                    <telerik:CategorySeriesItem Y="40" />
                </SeriesItems>
            </telerik:AreaSeries>
        </Series>
    </PlotArea>
</telerik:radhtmlchart>
The same result can be achieved programmatically by using the code in Example 2.
Example 2: Programmatic creation of the Area chart with the SeriesItems collection.
<telerik:RadHtmlChart runat="server" ID="Chart1" Width="400">
    <PlotArea>
        <Series>
            <telerik:AreaSeries>
            </telerik:AreaSeries>
        </Series>
    </PlotArea>
</telerik:RadHtmlChart>
AreaSeries areaSeries = Chart1.PlotArea.Series[0] as AreaSeries;

areaSeries.SeriesItems.Add(20);
areaSeries.SeriesItems.Add(35);
areaSeries.SeriesItems.Add(40);
Dim areaSeries As AreaSeries
areaSeries = CType(Chart1.PlotArea.Series.Item(0), AreaSeries)

areaSeries.SeriesItems.Add(20)
areaSeries.SeriesItems.Add(35)
areaSeries.SeriesItems.Add(40)