Background and Plot Areas
RadChart has been replaced by RadHtmlChart, Telerik's client-side charting component. If you are considering RadChart for new development, examine the RadHtmlChart documentation and online demos first to see if it will fit your development needs. If you are already using RadChart in your projects, you can migrate to RadHtmlChart by following these articles: Migrating Series, Migrating Axes, Migrating Date Axes, Migrating Databinding, Features parity. Support for RadChart is discontinued as of Q3 2014, but the control will remain in the assembly so it can still be used. We encourage you to use RadHtmlChart for new development.
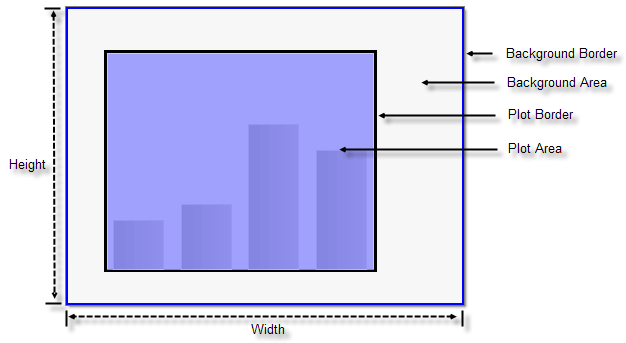
Chart Background
The background of the chart is the outermost rectangle that encloses all other elements of the chart. It stretches for the whole width and length of the output image of the chart. Using the Appearance property of the chart you can fully customize the chart background look and feel including:
Border visibility, color, pen style and width.
The Corners property lets you square or round each corner individually. The degree of rounding can be tailored.
FillStyle controls the fill color and type (solid, hatched, image, gradient).
ImageQuality and TextQuality properties can also be fine tuned.
Plot Area
The plot area is the working rectangular area between X and Y axes where data is displayed. The size of the plot depends on the chart background size and the chart margins, which define the distance between the border of the plot area and the border of the chart background. This area is represented by the RadChart PlotArea property. Some unique PlotArea properties are:
SeriesOrientation is an enumeration that orients the entire PlotArea either Vertical or Horizontal.
XAxis, YAxis, and YAxis2 properties. These axis properties control the scale and appearance of both axes. See the Axes topic for more information.
DataTable: Displays a spreadsheet style table of the data in the chart, typically just below the chart itself. See the DataTable topic for more information.
EmptySeriesMessage: The predefined message that displays in the PlotArea when there is no series data defined for the chart.
MarkedZones: Areas in the background of the chart that can be defined, labeled and filled. MarkedZones are used to highlight or group areas on the chart.
Like the RadChart as a whole, PlotArea has an Appearance property allowing customization:
Border visibility, color, pen style and width.
The Corners property lets you square or round each corner individually. The degree of rounding can be tailored.
FillStyle controls the fill color and type (solid, hatched, image, gradient).
The Dimensions property provides control of Width, Height, Margins, Paddings and if you want the dimensions to Autosize.
SeriesPalette is a property of the chart that lets you to choose a predefined skin color palette for each series.This can help provide a distinct look to differentiate each series.
The Shadow property lets you control shadow Blur, shadow Color, shadow Distance and Position relative to the plot area.