Alert Rules
The Alert Rules Settings allows you to configure the conditions for the different Alerts.
The Telerik Data Access Profiler detects the following problems:
- Long Running Query
- Select N+1 Problem
- Too Many Records Fetched
- Runtime Exception
- Client-side LINQ Query
Long Running Query
The Telerik Data Access Profiler and Tuning Advisor detects Long Running Queries.

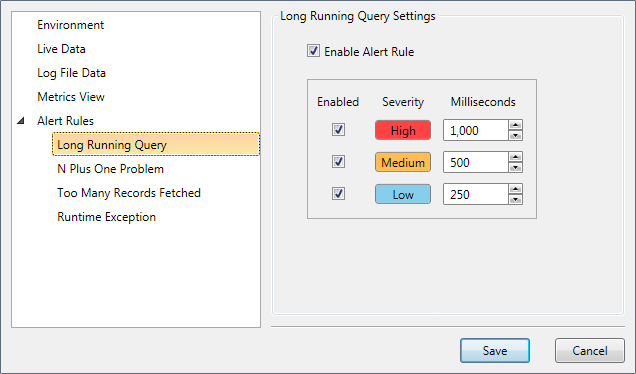
By default, depending on the execution time, the profiler will generate the following alerts:
- If the execution time is more than 250 milliseconds and less than 500 milliseconds, then an alert with severity level Low will be generated.
- If the execution time is more than 500 milliseconds and less than 1000 milliseconds, then an alert with severity level Medium will be generated.
- If the execution time is more than 1000 milliseconds, then an alert with severity level High will be generated.
You can enable/disable alerts for the Too Many Records Fetched problem by using the Enable Alert Rule setting.
Runtime Exception
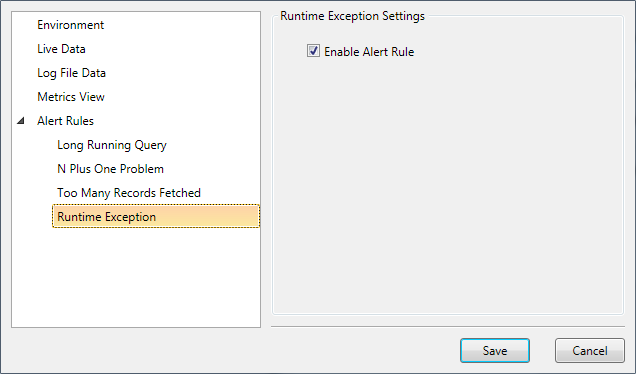
You could enable/disable alerts for Exceptions occurred in your application.

- Enable Alert Rule - enable/disable alerts for runtime exceptions.
Client-side LINQ Query
Some of the LINQ queries executed via the OpenAccessContext API, are not completely executed on the database server, i.e. they are not completely translated to SQL, but part of them is executed on the client-side using Linq to Objects. These queries do return the correct results to the user, but usually there is a certain performance penalty during their execution.
You could enable/disable alerts for Client-side LINQ Queries occurred in your application.

