Settings - Overview
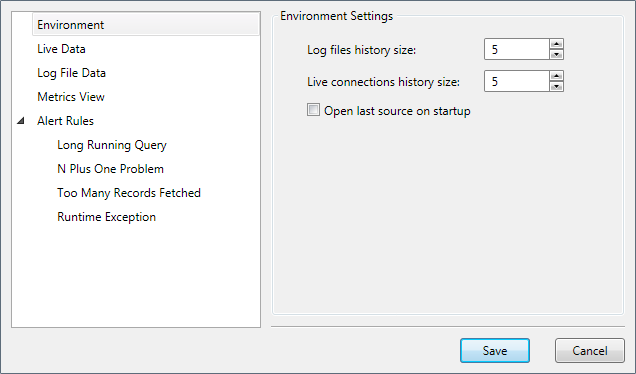
The Profiler Settings dialog allows you to configure the default behavior of the Telerik Data Access Profiler and Tuning Advisor.
To open the Profiler Settings dialog, use the Settings command from the Toolbar.

Via the Profiler Settings dialog, the following settings could be specified:
- Environment Settings - allows you to customize the behavior of the Telerik Data Access Profiler Environment.
- Live Data Settings - allows you to customize the behavior of the Telerik Data Access Profiler during online monitoring. These settings control the interval in which the chunks of data are read from the Web services and displayed in the UI.
- Log File Data Settings - allows you to customize the behavior of the Telerik Data Access Profiler during offline monitoring. These settings control the interval in which the chunks of log files are read and displayed in the UI. These settings are not relevant for small log data, but if you have something like 1GB of log files, the profiler is reading them in portions and the portions are displayed in the UI in some interval.
- Metrics View Settings - allows you to customize the Metrics View. Telerik Data Access produces two different kinds of data - metrics and events. Metrics are similar to the operating system counters. They produce snapshots of the system status like counting insert, update and delete statements per second. Respectively the Metrics View is the place where you could get visual information about these parameters.
- Alert Rules Settings - allows you to configure the conditions for the different alert levels.

