Alerts
An alert indicates that an issues has occurred somewhere in you application. For example, if the execution time of a query is more than 25 seconds, an alert might be triggered to indicate that this issue is occuring in your application. Alert have the following severity levels:
- Low
- Medium - indicates a potential problem or a current problem that is not serious. For example, a Medium alert will be generated if the execution time of a query is more than 15 seconds. It is recommended to investigate and solve a medium alert to prevent the underlying issue from becoming critical.
- High - usually indicates a (serious) problem, such as a long running query that may exceed the connection timeout.
The Telerik Data Access Profiler can detect the following types of problems:
- Long Running Query - a long running query.
- Select N+1 Problem - a data access anti-pattern where the database is accessed in a suboptimal way. Detecting Select N+1 problem usually means that the data fetch strategy of the application can be optimized.
- Too Many Records Fetched - indicates that a query fetched more records than usual. Such queries might take long time to execute, decreasing the performance of your application.
- Runtime Exception - indicates that an exception has occurred in your application.
- Client-side LINQ Query - queries that are not completely executed on the database server, i.e. they are not completely translated to SQL, but part of them is executed on the client-side using Linq to Objects.

Here you can find information about:
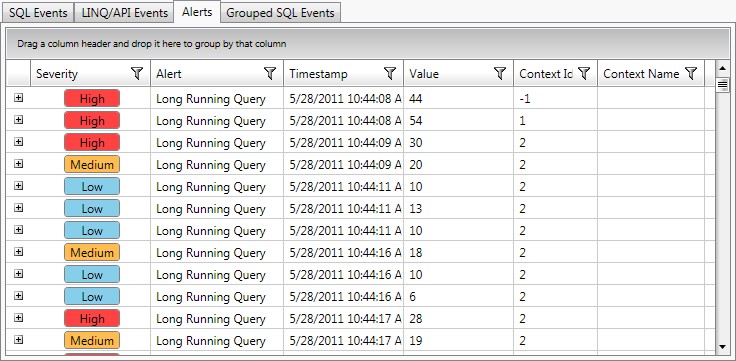
- Severity - the severity level of the problem.
- Alert - the type of the alert.
- Timestamp - shows the time when the problem is detected.
-
Value - displays a value related to the problem. For example, this might be the duration of a long running query.
- Context Id - displays the id of the OpenAccessContext.
- Context Name - displays the name of the context class.
Context Menu Operations
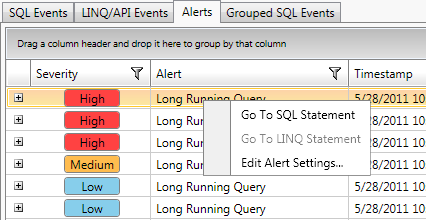
The context menu for the selected row in the Alerts grid exposes the following actions:
- Go To SQL Statement - navigates to the related SQL query in the SQL Events.
- Go To LINQ Statement - navigates to the corresponding LINQ record in the LINQ/API Events.
- Edit Alert Settings - allows you to configure the conditions for the different alert levels. For more information, see Alert Rules.

