Events View - Overview
Telerik Data Access produces two different kinds of data - metrics and events. Metrics are similar to the operating system counters. They produce snapshots of the system status like counting insert, update and delete statements per second. Log events contain the real operation information, including query parameters and stack traces. Respectively, the Events View is the place where you could see information about the events. The Metrics View shows visual information about the metrics.
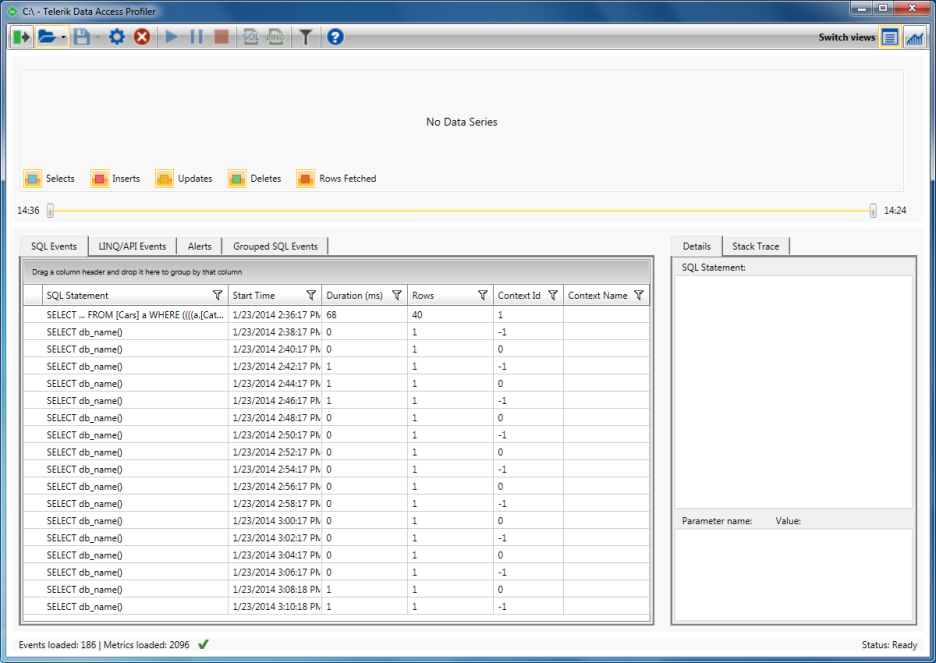
The Events View shows information about:
How to Show the Events View
If the Events View is not visible, you could use the Events View Toolbar Command.

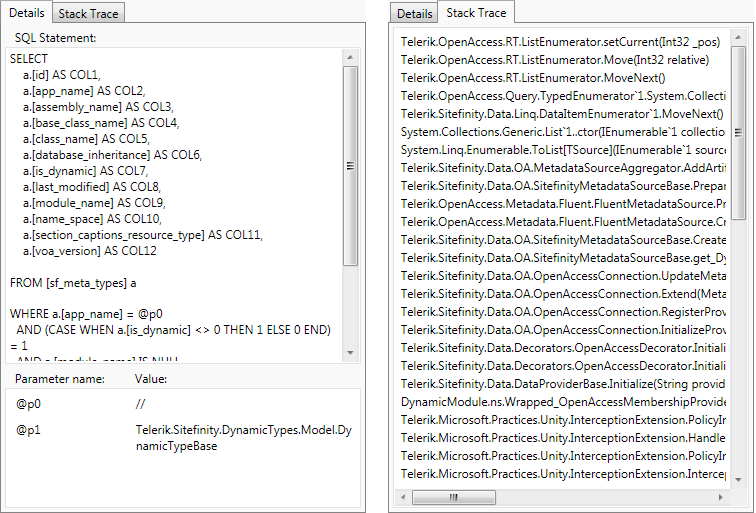
Details and Stack Trace
The Events View can give you the exact line in the source code that executes the query. Also, you can get detailed information about the executed SQL statement. For example, selecting a concrete SQL statement in the SQL Events grid will display detailed information about the SQL Statement and the Stack Trace. The Details and Stack Trace areas are located at the right part of the Events View.
Stack Trace information is available only for LINQ API calls.