Blazor Stock Chart Overview
The Blazor Stock Chart component allows you to visualize the deviation of a financial unit over a period of time to the user in a meaningful way so they can draw conclusions. You can use a variety of chart types and control all aspects of the chart's appearance - from colors and fonts, to paddings, margins, tooltips and templates.
The Telerik Stock Chart provides a Navigator to widen or shorten the defined period of time and zoom on particular part of the chart; and a crosshair to see precise values in data-dense charts.
The Stock Chart component is part of Telerik UI for Blazor, a
professional grade UI library with 110+ native components for building modern and feature-rich applications. To try it out sign up for a free 30-day trial.
![]()
Creating Stock Chart
- Add the
TelerikStockCharttag to your razor page. - Set the
DateFieldparameter of theTelerikStockChartto the corresponding property of the model for theOHLCand theCandlestickStockChart types. - Provide data to the series.
- (optional) Enable the navigator by including its
StockChartNavigatortag and adding a series that mirrors the main chart data to it.
Basic configuration of a Stock Chart with common settings
@* Basic Stock Chart with common settings and a navigator *@

<TelerikStockChart Width="700px"
                    Height="450px"
                    DateField="@nameof(StockDataPoint.Date)">

    <StockChartCategoryAxes>
        <StockChartCategoryAxis BaseUnit="@ChartCategoryAxisBaseUnit.Months"></StockChartCategoryAxis>
    </StockChartCategoryAxes>

    <StockChartSeriesItems>
        <StockChartSeries Type="StockChartSeriesType.Candlestick"
                            Name="Product 1"
                            Data="@StockChartProduct1Data"
                            OpenField="@nameof(StockDataPoint.Open)"
                            CloseField="@nameof(StockDataPoint.Close)"
                            HighField="@nameof(StockDataPoint.High)"
                            LowField="@nameof(StockDataPoint.Low)">
        </StockChartSeries>
    </StockChartSeriesItems>

    <StockChartNavigator>
        <StockChartNavigatorSeriesItems>
            <StockChartNavigatorSeries Type="StockChartSeriesType.Line"
                                        Name="Product 1"
                                        Data="@StockChartProduct1Data"
                                        Field="@(nameof(StockDataPoint.High))"
                            CategoryField="@(nameof(StockDataPoint.Date))">
            </StockChartNavigatorSeries>
        </StockChartNavigatorSeriesItems>
    </StockChartNavigator>

</TelerikStockChart>

@code {
    public List<StockDataPoint> StockChartProduct1Data { get; set; }

    protected override async Task OnInitializedAsync()
    {
        await GenerateChartData();
    }

    public async Task GenerateChartData()
    {
        StockChartProduct1Data = new List<StockDataPoint>()
        {
            new StockDataPoint(new DateTime(2019, 1, 1), 41.62m, 40.12m, 41.69m, 39.81m, 2632000),
            new StockDataPoint(new DateTime(2019, 2, 1), 39.88m, 40.12m, 41.12m, 39.75m, 3584700),
            new StockDataPoint(new DateTime(2019, 3, 1), 42m, 42.62m, 43.31m, 41.38m, 7631700),
            new StockDataPoint(new DateTime(2019, 4, 1), 42.25m, 43.06m, 43.31m, 41.12m, 4922200),
        };

        await Task.FromResult(StockChartProduct1Data);
    }

    public class StockDataPoint
    {
        public StockDataPoint() { }

        public StockDataPoint(DateTime date, decimal open, decimal close, decimal high, decimal low, int volume)
        {
            Date = date;
            Open = open;
            Close = close;
            High = high;
            Low = low;
            Volume = volume;
        }
        public DateTime Date { get; set; }

        public decimal Open { get; set; }

        public decimal Close { get; set; }

        public decimal High { get; set; }

        public decimal Low { get; set; }

        public int Volume { get; set; }
    }
}
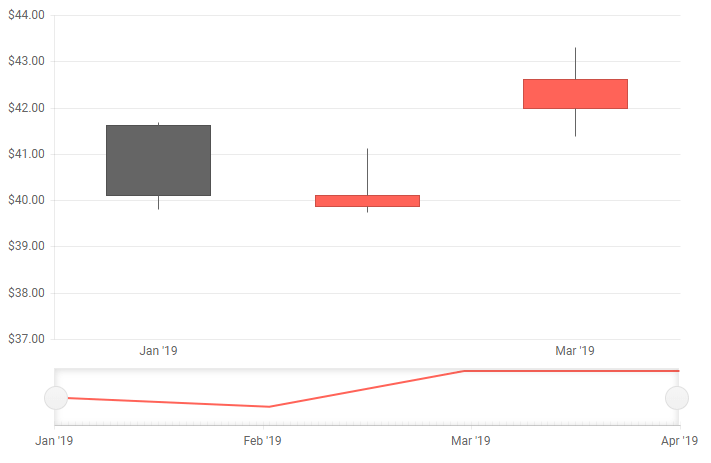
The result from the code snippet above
Customize Chart Elements - Nested Tags Settings
When configuring nested properties and child elements in your chart, the inner tags will contain their parent tag name and add specifics to its end. In general the structure of such nested tags will be <StockChart*Category**Specifics*> where the Category can be one of the following:
- CategoryAxis
- ChartArea
- Legend
- Navigator
- PlotArea
- SeriesItems
- Title
- Tooltip
- ValueAxis
- and others
To customize the chart, look for nested tags and their properties - the inner tags will contain their parent tag name and add specifics to its end. For example, the
StockChartSeriestag has aStockChartSeriesTooltiptag that exposes configuration options and more child tags.
You can customize all aspects of the stock chart by using the settings provided by the nested tags.
For example:
StockChartCategoryAxes > StockChartCategoryAxis > StockChartCategoryAxisLabels tags
This approach can be used with all tags that are applicable for the Chart type.
Stock Chart Size
To control the size of the StockChart, use the Width and the Height parameters.
You can also set the chart size in percentage values so it occupies its container when it renders. If the parent container size changes, you must call the chart's Refresh() C# method after the DOM has been redrawn and the new container dimensions are rendered. You can do this when you explicitly change container sizes (like in the example below), or from code that gets called by events like window.resize. You can find an example of making charts redraw on window.resize in the Responsive Chart sample.
Change the 100% chart size dynamically to have a responsive chart
You can make a responsive chart

<TelerikButton OnClick="@ResizeChart">Resize the container and redraw the chart</TelerikButton>

<div style="border: 1px solid red;width:@ContainerWidth; height: @ContainerHeight">

    <TelerikStockChart Width="100%"
                       Height="450px"
                       DateField="@nameof(StockDataPoint.Date)"
                       @ref="myStockChartRef">

        <StockChartCategoryAxes>
            <StockChartCategoryAxis BaseUnit="@ChartCategoryAxisBaseUnit.Months"></StockChartCategoryAxis>
        </StockChartCategoryAxes>

        <StockChartSeriesItems>
            <StockChartSeries Type="StockChartSeriesType.Candlestick"
                              Name="Product 1"
                              Data="@StockChartProduct1Data"
                              OpenField="@nameof(StockDataPoint.Open)"
                              CloseField="@nameof(StockDataPoint.Close)"
                              HighField="@nameof(StockDataPoint.High)"
                              LowField="@nameof(StockDataPoint.Low)">
            </StockChartSeries>
        </StockChartSeriesItems>

        <StockChartNavigator>
            <StockChartNavigatorSeriesItems>
                <StockChartNavigatorSeries Type="StockChartSeriesType.Line"
                                           Name="Product 1"
                                           Data="@StockChartProduct1Data"
                                           Field="@(nameof(StockDataPoint.High))"
                                           CategoryField="@(nameof(StockDataPoint.Date))">
                </StockChartNavigatorSeries>
            </StockChartNavigatorSeriesItems>
        </StockChartNavigator>

    </TelerikStockChart>

</div>

@code {
    Telerik.Blazor.Components.TelerikStockChart myStockChartRef { get; set; }

    string ContainerWidth { get; set; } = "400px";
    string ContainerHeight { get; set; } = "300px";

    public List<StockDataPoint> StockChartProduct1Data { get; set; }

    async Task ResizeChart()
    {
        ContainerHeight = "500px";
        ContainerWidth = "800px";

        await Task.Delay(20);

        myStockChartRef.Refresh();
    }

    protected override async Task OnInitializedAsync()
    {
        await GenerateChartData();
    }

    public async Task GenerateChartData()
    {
        StockChartProduct1Data = new List<StockDataPoint>()
    {
            new StockDataPoint(new DateTime(2019, 1, 1), 41.62m, 40.12m, 41.69m, 39.81m, 2632000),
            new StockDataPoint(new DateTime(2019, 2, 1), 39.88m, 40.12m, 41.12m, 39.75m, 3584700),
            new StockDataPoint(new DateTime(2019, 3, 1), 42m, 42.62m, 43.31m, 41.38m, 7631700),
            new StockDataPoint(new DateTime(2019, 4, 1), 42.25m, 43.06m, 43.31m, 41.12m, 4922200)
        };

        await Task.FromResult(StockChartProduct1Data);
    }

    public class StockDataPoint
    {
        public StockDataPoint() { }

        public StockDataPoint(DateTime date, decimal open, decimal close, decimal high, decimal low, int volume)
        {
            Date = date;
            Open = open;
            Close = close;
            High = high;
            Low = low;
            Volume = volume;
        }
        public DateTime Date { get; set; }

        public decimal Open { get; set; }

        public decimal Close { get; set; }

        public decimal High { get; set; }

        public decimal Low { get; set; }

        public int Volume { get; set; }
    }
}
StockChart Parameters
The following table lists StockChart parameters, which are not discussed elsewhere in the component documentation.
| Parameter | Type and Default value | Description |
|---|---|---|
Width |
string |
Controls the width of the StockChart. |
Height |
string |
Controls the height of the StockChart. |
Class |
string |
Renders a custom CSS class on the <div class="k-stockchart"> element. |
Transitions |
bool? |
Controls if the StockChart renders animations. |
RenderAs |
RenderingMode? ( SVG) |
Controls if the StockChart renders as SVG or Canvas. |
Component Reference and Methods
To execute StockChart methods, obtain reference to the component instance via @ref.
| Method | Description |
|---|---|
| Refresh | You can use that method to programmatically re-render the component. |