GridLine Annotations
GridLine annotations are lines or circles that cross the chart grid at a location on the axis, specified by their Value property.
Cartesian GridLine Annotation
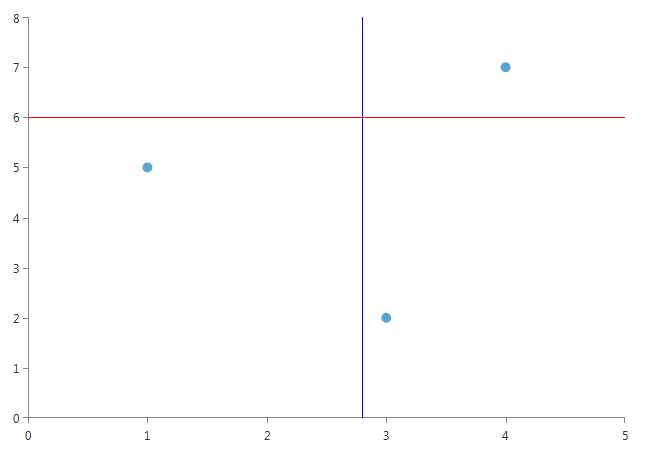
In the case of RadCartesianChart, the CartesianGridLineAnnotation represents a vertical or horizontal line that crosses the entire plot area.
Example 1: Adding CartesianGridLineAnnotations
<telerik:RadCartesianChart x:Name="cartesianChart">
    <telerik:RadCartesianChart.Annotations>
        <telerik:CartesianGridLineAnnotation Axis="{Binding ElementName=verticalAxis}"
                                                Value="6"
                                                Stroke="Red"
                                                StrokeThickness="1"/>
        <telerik:CartesianGridLineAnnotation Axis="{Binding ElementName=horizontalAxis}"
                                                Value="2.8"
                                                Stroke="Blue"
                                                StrokeThickness="1"/>
    </telerik:RadCartesianChart.Annotations>

    <telerik:RadCartesianChart.Series>
        <telerik:ScatterPointSeries>
            <telerik:ScatterPointSeries.DataPoints>
                <telerik:ScatterDataPoint XValue="1" YValue="5"/>
                <telerik:ScatterDataPoint XValue="3" YValue="2"/>
                <telerik:ScatterDataPoint XValue="4" YValue="7"/>
            </telerik:ScatterPointSeries.DataPoints>
        </telerik:ScatterPointSeries>
    </telerik:RadCartesianChart.Series>

    <telerik:RadCartesianChart.VerticalAxis>
        <telerik:LinearAxis x:Name="verticalAxis"/>
    </telerik:RadCartesianChart.VerticalAxis>

    <telerik:RadCartesianChart.HorizontalAxis>
        <telerik:LinearAxis x:Name="horizontalAxis"/>
    </telerik:RadCartesianChart.HorizontalAxis>
</telerik:RadCartesianChart>
Figure 1: CartesianGridLineAnnotations in RadCartesianChart
Polar Axis GridLine Annotation
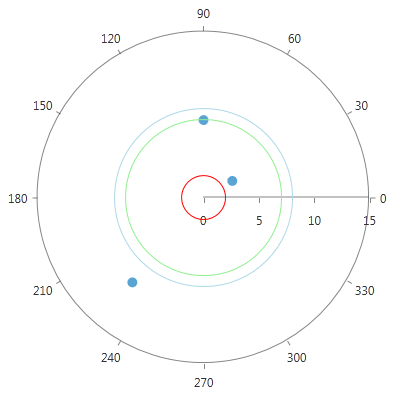
PolarAxisGridLineAnnotations represent concentric circles that cross the polar axis at the corresponding Value.
Example 2: Adding PolarAxisGridLineAnnotation
<telerik:RadPolarChart>
    <telerik:RadPolarChart.Annotations>
        <telerik:PolarAxisGridLineAnnotation Value="2" Stroke="Red"/>
        <telerik:PolarAxisGridLineAnnotation Value="7" Stroke="LightGreen"/>
        <telerik:PolarAxisGridLineAnnotation Value="8" Stroke="LightBlue"/>
    </telerik:RadPolarChart.Annotations>

    <telerik:RadPolarChart.Series>
        <telerik:PolarPointSeries>
            <telerik:PolarPointSeries.DataPoints>
                <telerik:PolarDataPoint Value="2" Angle="30"/>
                <telerik:PolarDataPoint Value="7" Angle="90"/>
                <telerik:PolarDataPoint Value="8" Angle="230"/>
            </telerik:PolarPointSeries.DataPoints>
        </telerik:PolarPointSeries>
    </telerik:RadPolarChart.Series>

    <telerik:RadPolarChart.RadialAxis>
        <telerik:NumericRadialAxis/>
    </telerik:RadPolarChart.RadialAxis>

    <telerik:RadPolarChart.PolarAxis>
        <telerik:PolarAxis/>
    </telerik:RadPolarChart.PolarAxis>
</telerik:RadPolarChart>
Figure 2: PolarAxisGridLineAnnotations in RadPolarChart
Radial Axis GridLine Annotation
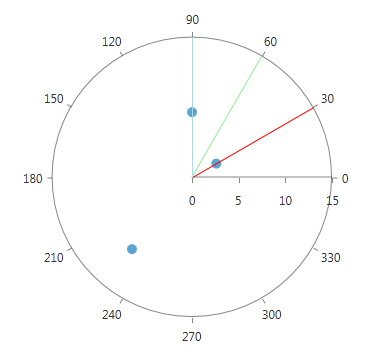
RadialAxisGridLineAnnotations basically represent the radius of a RadPolarChart.
Example 3: Defining RadialAxisGridLineAnnotation
<telerik:RadPolarChart>
    <telerik:RadPolarChart.Annotations>
        <telerik:RadialAxisGridLineAnnotation Value="30" Stroke="Red"/>
        <telerik:RadialAxisGridLineAnnotation Value="60" Stroke="LightGreen"/>
        <telerik:RadialAxisGridLineAnnotation Value="90" Stroke="LightBlue"/>
    </telerik:RadPolarChart.Annotations>

    <telerik:RadPolarChart.Series>
        <telerik:PolarPointSeries>
            <telerik:PolarPointSeries.DataPoints>
                <telerik:PolarDataPoint Value="2" Angle="30"/>
                <telerik:PolarDataPoint Value="7" Angle="90"/>
                <telerik:PolarDataPoint Value="8" Angle="230"/>
            </telerik:PolarPointSeries.DataPoints>
        </telerik:PolarPointSeries>
    </telerik:RadPolarChart.Series>

    <telerik:RadPolarChart.RadialAxis>
        <telerik:NumericRadialAxis/>
    </telerik:RadPolarChart.RadialAxis>

    <telerik:RadPolarChart.PolarAxis>
        <telerik:PolarAxis/>
    </telerik:RadPolarChart.PolarAxis>
</telerik:RadPolarChart>
Figure 3: RadialAxisGridLineAnnotations in RadPolarChart
Properties
Common:
DashArray : Gets or sets a collection of System.Double values that indicate the pattern of dashes and gaps that is used to outline annotations.
Stroke : Gets or sets the System.Windows.Media.Brush that specifies how the annotations outline is painted.
StrokeThickness : Gets or sets the width of the annotations stroke outline.
CartesianGridLineAnnotation:
Axis : The CartesianGridLineAnnotation needs to be associated with horizontal or vertical axis explicitly.
Value (of type object) : The place on the associated axis where the annotation crosses it. When the associated axis is numerical (Linear or Logarithmic) a numeric value is expected and when it is a CategoricalAxis - a category.
Label : The string that is displayed in the label.
LabelDefinition : Defines the position of the annotation label. Check the Annotation Labels help topic for more details.
PolarAxisGridLineAnnotations:
- Value (of type double) : Specifies the location on the polar axis (the radius), where the grid line will cross.
RadialAxisGridLineAnnotation:
- Value (of type object) : Specifies the location on the radial axis, where the grid line will cross. When the radial axis is NumericRadialAxis a numeric value is expected and when it is a CategoricalRadialAxis - a category.