Annotation Labels
The CartesianStrokedAnnotation class provides infrastructure for annotation labels.
Only the annotations deriving from CartesianStrokedAnnotation ( CartesianGridLine and CartesianPlotBand ) have out-of-the-box support for this feature.
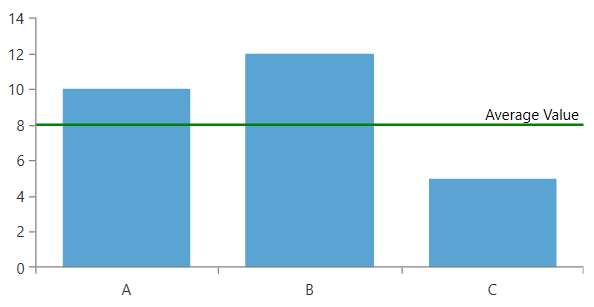
Setting a Label
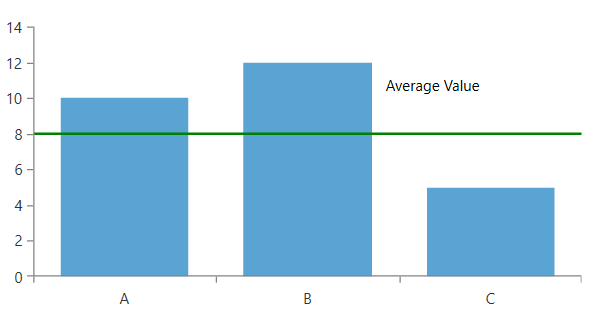
To show the annotation's label, set its Label property.
Example 1: Setting annotation label
<telerik:RadCartesianChart>
    <telerik:RadCartesianChart.VerticalAxis>
        <telerik:LinearAxis x:Name="verticalAxis"/>
    </telerik:RadCartesianChart.VerticalAxis>
    <telerik:RadCartesianChart.HorizontalAxis>
        <telerik:CategoricalAxis/>
    </telerik:RadCartesianChart.HorizontalAxis>
    <telerik:RadCartesianChart.Series>
        <telerik:BarSeries>
            <telerik:BarSeries.DataPoints>
                <telerik:CategoricalDataPoint Category="A" Value="10"/>
                <telerik:CategoricalDataPoint Category="B" Value="12"/>
                <telerik:CategoricalDataPoint Category="C" Value="5"/>
            </telerik:BarSeries.DataPoints>
        </telerik:BarSeries>
    </telerik:RadCartesianChart.Series>
    <telerik:RadCartesianChart.Annotations>
        <telerik:CartesianGridLineAnnotation Axis="{Binding ElementName=verticalAxis}" Value="8" Stroke="Green" StrokeThickness="2"
                                             Label="Average Value" />
    </telerik:RadCartesianChart.Annotations>
</telerik:RadCartesianChart>
Figure 1: Annotation Label
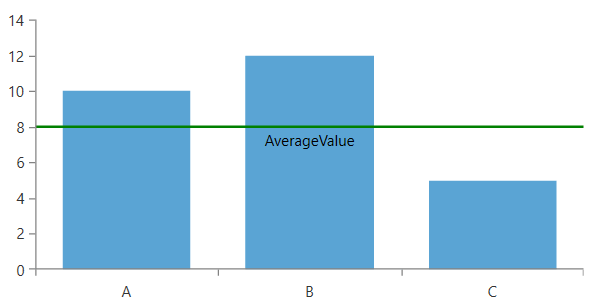
Using Label Definition
The chart annotation labels are adjusted using the LabelDefinition property. The property accepts a value of type ChartAnnotationLabelDefinition that allows you to style and position the label.
Example 2: Setting LabelDefinition
<telerik:RadCartesianChart>
    <telerik:RadCartesianChart.VerticalAxis>
        <telerik:LinearAxis x:Name="verticalAxis"/>
    </telerik:RadCartesianChart.VerticalAxis>
    <telerik:RadCartesianChart.HorizontalAxis>
        <telerik:CategoricalAxis/>
    </telerik:RadCartesianChart.HorizontalAxis>
    <telerik:RadCartesianChart.Series>
        <telerik:BarSeries>
            <telerik:BarSeries.DataPoints>
                <telerik:CategoricalDataPoint Category="A" Value="10"/>
                <telerik:CategoricalDataPoint Category="B" Value="12"/>
                <telerik:CategoricalDataPoint Category="C" Value="5"/>
            </telerik:BarSeries.DataPoints>
        </telerik:BarSeries>
    </telerik:RadCartesianChart.Series>
    <telerik:RadCartesianChart.Annotations>
        <telerik:CartesianGridLineAnnotation Axis="{Binding ElementName=verticalAxis}"
                                             Value="8"
                                             Stroke="Green"
                                             StrokeThickness="2"
                                             Label="AverageValue">
            <telerik:CartesianGridLineAnnotation.LabelDefinition>
                <telerik:ChartAnnotationLabelDefinition Location="Inside" HorizontalAlignment="Center"/>
            </telerik:CartesianGridLineAnnotation.LabelDefinition>
        </telerik:CartesianGridLineAnnotation>
    </telerik:RadCartesianChart.Annotations>
</telerik:RadCartesianChart>
Figure 2: Centered Label
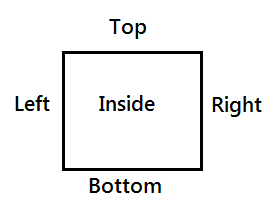
Label Positioning
Annotations provide a mechanism for label positioning that consists of three layers - primary (via the Location property), secondary (via the HorizontalAlignment/VerticalAlignment property), and tertiary (via the HorizontalOffset/ VerticalOffset property).
-
Location property: It defines the primary location of the annotation label visual. It allows you to position the label in 5 different positions, as illustrated below.
Figure 3: Locations relative to the annotation's visual
-
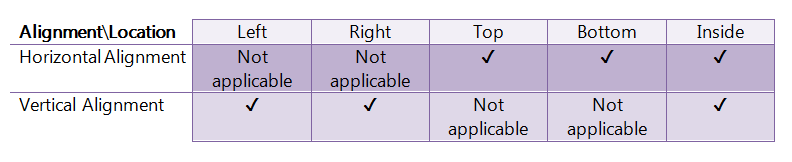
Horizontal / Vertical Alignment property: In conjunction with Location property, you can use the HorizontalAlignment and VerticalAlignment properties to further specify the position of the label. Refer to the table below for possible combinations of these properties:
Figure 4: Possible alignment-location combinations
Horizontal / Vertical Offset property: Besides the Location, HorizontalAlignment and Vertical Alignment, you can use the HorizontalOffset and VerticalOffset properties to specify an offset in pixels. This offset is applied after the aforementioned properties.
Example 3: Custom positioned label
<telerik:RadCartesianChart>
    <telerik:RadCartesianChart.VerticalAxis>
        <telerik:LinearAxis x:Name="verticalAxis"/>
    </telerik:RadCartesianChart.VerticalAxis>
    <telerik:RadCartesianChart.HorizontalAxis>
        <telerik:CategoricalAxis/>
    </telerik:RadCartesianChart.HorizontalAxis>
    <telerik:RadCartesianChart.Series>
        <telerik:BarSeries>
            <telerik:BarSeries.DataPoints>
                <telerik:CategoricalDataPoint Category="A" Value="10"/>
                <telerik:CategoricalDataPoint Category="B" Value="12"/>
                <telerik:CategoricalDataPoint Category="C" Value="5"/>
            </telerik:BarSeries.DataPoints>
        </telerik:BarSeries>
    </telerik:RadCartesianChart.Series>
    <telerik:RadCartesianChart.Annotations>
        <telerik:CartesianGridLineAnnotation Axis="{Binding ElementName=verticalAxis}"
                                             Value="8"
                                             Stroke="Green"
                                             StrokeThickness="2"
                                             Label="AverageValue">
            <telerik:CartesianGridLineAnnotation.LabelDefinition>
                <telerik:ChartAnnotationLabelDefinition Location="Top"
                                                        HorizontalAlignment="Center"
                                                        VerticalOffset="-30"
                                                        HorizontalOffset="100"/>
            </telerik:CartesianGridLineAnnotation.LabelDefinition>
        </telerik:CartesianGridLineAnnotation>
    </telerik:RadCartesianChart.Annotations>
</telerik:RadCartesianChart>
Figure 5: Custom positioned label
Default Visual Style
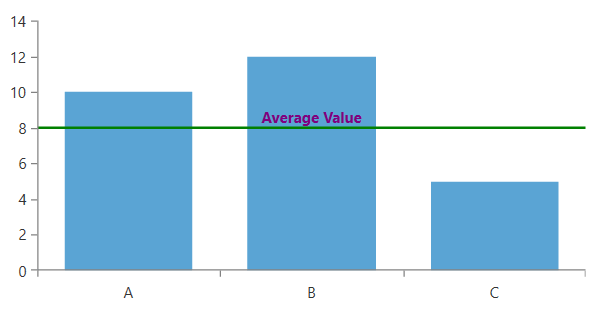
The default visual element of the label is a native TextBlock. To customize it you can use the DefaultVisualStyle property of the ChartAnnotationLabelDefinition.
Example 4: Setting DefaultVisualStyle
<telerik:RadCartesianChart>
    <telerik:RadCartesianChart.VerticalAxis>
        <telerik:LinearAxis x:Name="verticalAxis"/>
    </telerik:RadCartesianChart.VerticalAxis>
    <telerik:RadCartesianChart.HorizontalAxis>
        <telerik:CategoricalAxis/>
    </telerik:RadCartesianChart.HorizontalAxis>
    <telerik:RadCartesianChart.Series>
        <telerik:BarSeries>
            <telerik:BarSeries.DataPoints>
                <telerik:CategoricalDataPoint Category="A" Value="10"/>
                <telerik:CategoricalDataPoint Category="B" Value="12"/>
                <telerik:CategoricalDataPoint Category="C" Value="5"/>
            </telerik:BarSeries.DataPoints>
        </telerik:BarSeries>
    </telerik:RadCartesianChart.Series>
    <telerik:RadCartesianChart.Annotations>
        <telerik:CartesianGridLineAnnotation Axis="{Binding ElementName=verticalAxis}"
                                             Value="8"
                                             Stroke="Green"
                                             StrokeThickness="2"
                                             Label="Average Value">
            <telerik:CartesianGridLineAnnotation.LabelDefinition>
                <telerik:ChartAnnotationLabelDefinition Location="Top" HorizontalAlignment="Center">
                    <telerik:ChartAnnotationLabelDefinition.DefaultVisualStyle>
                        <Style TargetType="TextBlock">
                            <Setter Property="Foreground" Value="Purple" />
                            <Setter Property="FontWeight" Value="Bold" />
                        </Style>
                    </telerik:ChartAnnotationLabelDefinition.DefaultVisualStyle>
                </telerik:ChartAnnotationLabelDefinition>
            </telerik:CartesianGridLineAnnotation.LabelDefinition>
        </telerik:CartesianGridLineAnnotation>
    </telerik:RadCartesianChart.Annotations>
</telerik:RadCartesianChart>
Figure 6: Customized Label Style
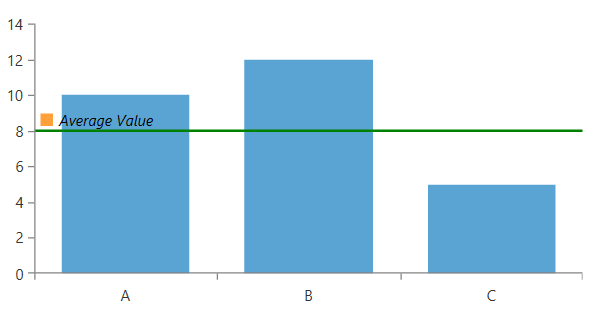
Defining a Custom Label Template
To replace the default label visual element with an entirely custom UI you can use the Template property of the ChartAnnotationLabelDefinition.
Example 5: Setting custom label template
<telerik:RadCartesianChart>
     <telerik:RadCartesianChart.VerticalAxis>
            <telerik:LinearAxis x:Name="verticalAxis"/>
        </telerik:RadCartesianChart.VerticalAxis>
        <telerik:RadCartesianChart.HorizontalAxis>
            <telerik:CategoricalAxis/>
        </telerik:RadCartesianChart.HorizontalAxis>
        <telerik:RadCartesianChart.Series>
            <telerik:BarSeries>
                <telerik:BarSeries.DataPoints>
                    <telerik:CategoricalDataPoint Category="A" Value="10"/>
                    <telerik:CategoricalDataPoint Category="B" Value="12"/>
                    <telerik:CategoricalDataPoint Category="C" Value="5"/>
                </telerik:BarSeries.DataPoints>
            </telerik:BarSeries>
        </telerik:RadCartesianChart.Series>
        <telerik:RadCartesianChart.Annotations>
            <telerik:CartesianGridLineAnnotation Axis="{Binding ElementName=verticalAxis}"
                                                 Value="8"
                                                 Stroke="Green"
                                                 StrokeThickness="2"
                                                 Label="Average Value">
                <telerik:CartesianGridLineAnnotation.LabelDefinition>
                    <telerik:ChartAnnotationLabelDefinition Location="Top" HorizontalOffset="5">
                        <telerik:ChartAnnotationLabelDefinition.Template>
                            <DataTemplate>
                                <StackPanel Orientation="Horizontal">
                                    <Rectangle Fill="#FFA03B" Width="10" Height="10" />
                                    <TextBlock Text="{Binding}" Margin="5 0 0 0" FontStyle="Italic"/>
                                </StackPanel>
                            </DataTemplate>
                        </telerik:ChartAnnotationLabelDefinition.Template>
                    </telerik:ChartAnnotationLabelDefinition>
                </telerik:CartesianGridLineAnnotation.LabelDefinition>
            </telerik:CartesianGridLineAnnotation>
        </telerik:RadCartesianChart.Annotations>
    </telerik:RadCartesianChart.Annotations>
</telerik:RadCartesianChart>
Figure 7: Customized Label Template