AnnotationsProvider
RadChartView supports an annotations provider that is used for creating chart annotations in a data-bound scenario. Basically, the provider accepts a collection of models describing the annotations and a descriptor (or descriptors) that defines their type and appearance.
The provider is set through the AnnotationsProvider property of the chart (see Example 1) and it can be populated with a collection of models through its Source property.
Example 1: Setting the AnnotationsProvider
<telerik:RadCartesianChart.AnnotationsProvider>
    <telerik:ChartAnnotationsProvider Source="{Binding AnnotationModelsCollection}" />
</telerik:RadCartesianChart.AnnotationsProvider/>
You can choose from a few approaches to determine the type and set up the annotations:
You can find an example of the provider in the How to Use AnnotationsProvider section.
Defining a Descriptor
You can define an object of type ChartAnnotationDescriptor for the provider (Example 2). The descriptor exposes a single property of type Style that determines the type of the annotation. You can use the style to set up the annotation - set its position and visual appearance.
Example 2: Setting a ChartAnnotationDescriptor
<telerik:RadCartesianChart.AnnotationsProvider>
    <telerik:ChartAnnotationsProvider Source="{Binding AnnotationModelsCollection}">
        <telerik:ChartAnnotationDescriptor>
            <telerik:ChartAnnotationDescriptor.Style>
                <Style TargetType="telerik:CartesianGridLineAnnotation">
                    <Setter Property="Axis" Value="{Binding ElementName=verticalAxis}" />
                    <Setter Property="Value" Value="{Binding Value}" />
                    <Setter Property="Stroke" Value="{Binding Stroke}" />
                </Style>
            </telerik:ChartAnnotationDescriptor.Style>
        </telerik:ChartAnnotationDescriptor>
    </telerik:ChartAnnotationsProvider>
</telerik:RadCartesianChart.AnnotationsProvider>
The data context passed in the Style of the descriptor is an object from the Source collection.
Defining a Descriptor Selector
The annotations provider allows you to decide what type of annotation to create at runtime. You can do that using a descriptor selector. You can create a custom class that derives from ChartAnnotationDescriptorSelector and override its SelectDescriptor() method (Example 3). Based on a condition, you can return different styles for each item from the Source collection.
Example 3: Creating ChartAnnotationDescriptorSelector
public class MyAnnotationDescriptorSelector : ChartAnnotationDescriptorSelector
{
    public ChartAnnotationDescriptor MarkedZoneAnnotationDescriptor { get; set; }
    public ChartAnnotationDescriptor GridLineAnnotationDescriptor { get; set; }

    public override ChartAnnotationDescriptor SelectDescriptor(ChartAnnotationsProvider provider, object context)
    {
    // Here you can define logic that returns different descriptors based on a condition.
        if (context is ModelA)
        {
            return this.MarkedZoneAnnotationDescriptor;
        }
        else if (context is ModelB)
        {
            return this.GridLineAnnotationDescriptor;
        }
        else
        {
            return base.SelectDescriptor(provider, context);
        }
    }
}
Example 4: Setting the descriptor selector
<telerik:RadCartesianChart.AnnotationsProvider>
    <telerik:ChartAnnotationsProvider Source="{Binding AnnotationModelsCollection}">
        <telerik:ChartAnnotationsProvider.AnnotationDescriptorSelector>
            <local:MyAnnotationDescriptorSelector />
        </telerik:ChartAnnotationsProvider.AnnotationDescriptorSelector>
    </telerik:ChartAnnotationsProvider>
</telerik:RadCartesianChart.AnnotationsProvider>
Using the AnnotationCreated Event
The AnnotationCreated event allows you to set up or modify the created annotations at runtime. Also, you can use the event to replace the created annotation with a new one.
As Example 5 and Example 6 demonstrate, you can use the event to create an annotation and let the provider add it in the chart's Annotations collection.
The event arguments are of type ChartAnnotationCreatedEventArgs and expose the following properties:
- Annotation: A property of type ChartAnnotation that holds the created annotation.
- Context: A property of type object that holds the model of the annotation.
Example 5: Subscribing for the AnnotationCreated event
<telerik:ChartAnnotationsProvider AnnotationCreated="ChartAnnotationsProvider_AnnotationCreated">
Example 6: Defining the AnnotationCreated event handler
private void ChartAnnotationsProvider_AnnotationCreated(object sender, ChartAnnotationCreatedEventArgs e)
{
    object annotationViewModel = e.Context;
    var annotation = new CartesianGridLineAnnotation();
    // set up the annotation
    e.Annotation = annotation;
}
How to Use AnnotationsProvider
The following example demonstrates how to use AnnotationsProvider and AnnotationDescriptorSelector.
You can find all of the described features of the provider demonstrated in our AnnotationsProvider SDK example.
Example 7: Setting up the view
<telerik:RadCartesianChart>
    <telerik:RadCartesianChart.VerticalAxis>
        <telerik:LinearAxis x:Name="verticalAxis" />
    </telerik:RadCartesianChart.VerticalAxis>
    <telerik:RadCartesianChart.HorizontalAxis>
        <telerik:CategoricalAxis />
    </telerik:RadCartesianChart.HorizontalAxis>

    <telerik:LineSeries>
        <telerik:LineSeries.DataPoints>
            <telerik:CategoricalDataPoint Category="January" Value="2" />
            <telerik:CategoricalDataPoint Category="February" Value="5" />
            <telerik:CategoricalDataPoint Category="March" Value="3" />
            <telerik:CategoricalDataPoint Category="April" Value="10" />
            <telerik:CategoricalDataPoint Category="May" Value="9" />
            <telerik:CategoricalDataPoint Category="June" Value="7" />
            <telerik:CategoricalDataPoint Category="July" Value="1" />
        </telerik:LineSeries.DataPoints>
    </telerik:LineSeries>
</telerik:RadCartesianChart>
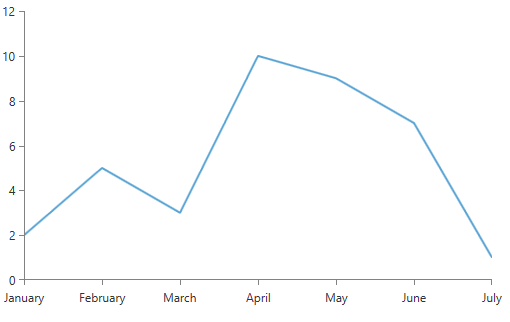
Figure 1: The initial view
The classes defined in Example 8 will be used as models for the annotations.
Example 8: Defining the annotation models
public class GridLineAnnotationModel
{
    public double Value { get; set; }
    public Brush Fill { get; set; }
}

public class MarkedZoneAnnotationModel
{
    public double VerticalFrom { get; set; }
    public double VerticalTo { get; set; }
    public string HorizontalFrom { get; set; }
    public string HorizontalTo { get; set; }
    public Brush Fill { get; set; }
}
Example 9: Defining a main view model class
public class MainViewModel
{
    public ObservableCollection<object> AnnotationModelsCollection { get; set; }
    public MainViewModel()
    {
        this.AnnotationModelsCollection = new ObservableCollection<object>()
        {
            new MarkedZoneAnnotationModel()
            {
                HorizontalFrom = "February",
                HorizontalTo="April",
                VerticalTo = 5,
                VerticalFrom = 2,
                Fill = Brushes.Green,
            },
            new GridLineAnnotationModel() { Value = 6, Fill = Brushes.Orange, },
        };
    }
}
Example 10 demonstrates a custom AnnotationDescriptorSelector that returns a different descriptor based on the type of the model.
Example 10: Creating the descriptor selector
public class MyAnnotationsDescriptorSelector : ChartAnnotationDescriptorSelector
{
    public ChartAnnotationDescriptor MarkedZoneAnnotationDescriptor { get; set; }
    public ChartAnnotationDescriptor GridLineAnnotationDescriptor { get; set; }

    public override ChartAnnotationDescriptor SelectDescriptor(ChartAnnotationsProvider provider, object context)
    {
        if (context is MarkedZoneAnnotationModel)
        {
            return this.MarkedZoneAnnotationDescriptor;
        }
        else if (context is GridLineAnnotationModel)
        {
            return this.GridLineAnnotationDescriptor;
        }

        return base.SelectDescriptor(provider, context);
    }
}
Example 11 demonsrates how to define the AnnotationProvider and set its AnnotationDescriptorSelector.
Example 11: Setting the annotation descriptor
<telerik:RadCartesianChart>
    <telerik:RadCartesianChart.VerticalAxis>
        <telerik:LinearAxis x:Name="verticalAxis" />
    </telerik:RadCartesianChart.VerticalAxis>
    <telerik:RadCartesianChart.HorizontalAxis>
        <telerik:CategoricalAxis />
    </telerik:RadCartesianChart.HorizontalAxis>
    <telerik:LineSeries>
        <telerik:LineSeries.DataPoints>
            <telerik:CategoricalDataPoint Category="January" Value="2" />
            <telerik:CategoricalDataPoint Category="February" Value="5" />
            <telerik:CategoricalDataPoint Category="March" Value="3" />
            <telerik:CategoricalDataPoint Category="April" Value="10" />
            <telerik:CategoricalDataPoint Category="May" Value="9" />
            <telerik:CategoricalDataPoint Category="June" Value="7" />
            <telerik:CategoricalDataPoint Category="July" Value="1" />
        </telerik:LineSeries.DataPoints>
    </telerik:LineSeries>

    <telerik:RadCartesianChart.AnnotationsProvider>
        <telerik:ChartAnnotationsProvider Source="{Binding AnnotationModelsCollection}">
            <telerik:ChartAnnotationsProvider.AnnotationDescriptorSelector>
                <local:MyAnnotationsDescriptorSelector>
                    <local:MyAnnotationsDescriptorSelector.MarkedZoneAnnotationDescriptor>
                        <telerik:ChartAnnotationDescriptor>
                            <telerik:ChartAnnotationDescriptor.Style>
                                <Style TargetType="telerik:CartesianMarkedZoneAnnotation">
                                    <Setter Property="VerticalFrom" Value="{Binding VerticalFrom}" />
                                    <Setter Property="VerticalTo" Value="{Binding VerticalTo}" />
                                    <Setter Property="HorizontalFrom" Value="{Binding HorizontalFrom}" />
                                    <Setter Property="HorizontalTo" Value="{Binding HorizontalTo}" />
                                    <Setter Property="Fill" Value="{Binding Fill}" />
                                    <Setter Property="Opacity" Value="0.5"/>
                                </Style>
                            </telerik:ChartAnnotationDescriptor.Style>
                        </telerik:ChartAnnotationDescriptor>
                    </local:MyAnnotationsDescriptorSelector.MarkedZoneAnnotationDescriptor>
                    <local:MyAnnotationsDescriptorSelector.GridLineAnnotationDescriptor>
                        <telerik:ChartAnnotationDescriptor>
                            <telerik:ChartAnnotationDescriptor.Style>
                                <Style TargetType="telerik:CartesianGridLineAnnotation">
                                    <Setter Property="Axis" Value="{Binding ElementName=verticalAxis}" />
                                    <Setter Property="Value" Value="{Binding Value}" />
                                    <Setter Property="Stroke" Value="{Binding Stroke}" />
                                    <Setter Property="StrokeThickness" Value="2" />
                                </Style>
                            </telerik:ChartAnnotationDescriptor.Style>
                        </telerik:ChartAnnotationDescriptor>
                    </local:MyAnnotationsDescriptorSelector.GridLineAnnotationDescriptor>
                </local:MyAnnotationsDescriptorSelector>
            </telerik:ChartAnnotationsProvider.AnnotationDescriptorSelector>
        </telerik:ChartAnnotationsProvider>
    </telerik:RadCartesianChart.AnnotationsProvider>
</telerik:RadCartesianChart>
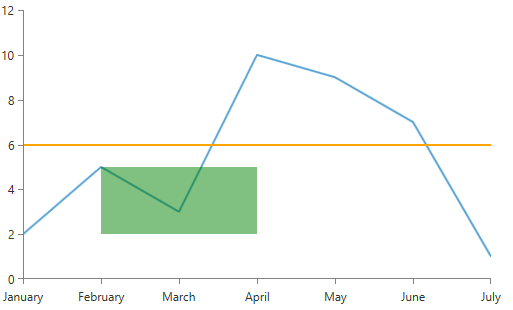
Figure 2: The final result that shows the generated annotations