Reports
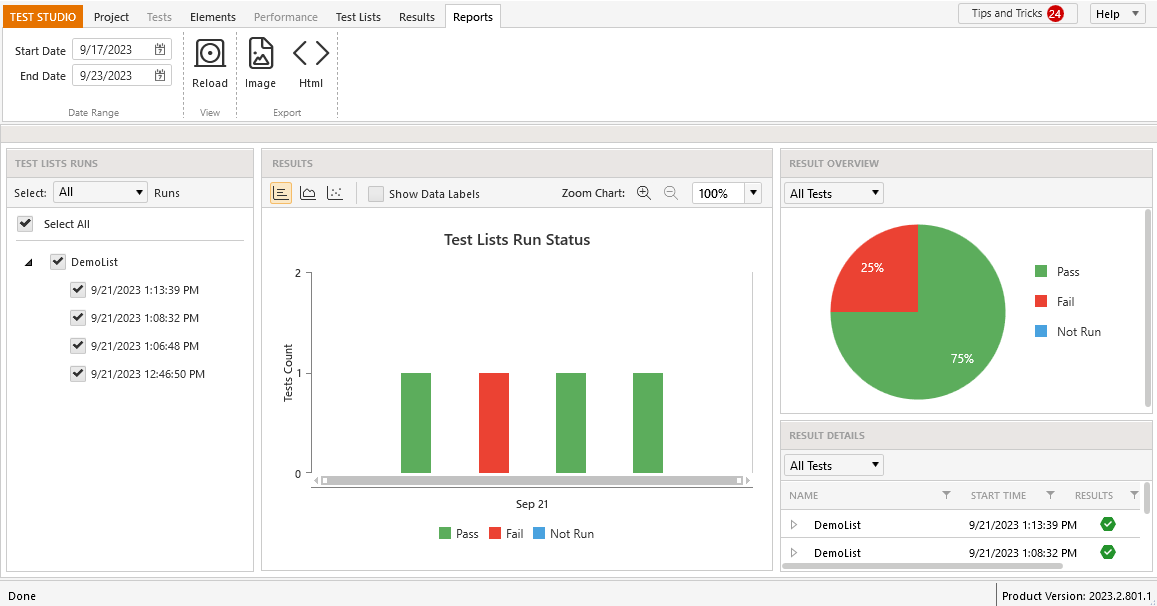
With the expanded reporting functionality, spotting test pass/failure trends and identifying weak spots in tested applications is swift and effortless. From the Reports tab, you have the ability to:
To explore test list results over time.
Experience enhanced visualization of test results through interactive graphs and charts.
Export reports as a PNG image or HTML file.
Leave comments within reports.

Test List Runs View
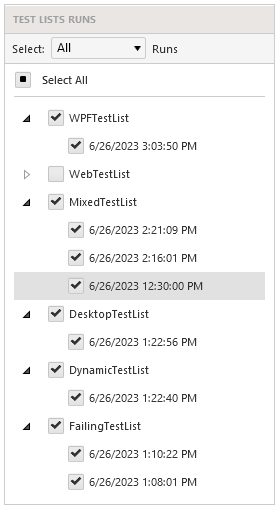
The Test List Runs view allows you to select a set of test list and runs for the given time frame as per your requirements - a single test list execution(s), specific time range executions for a single or a set of test lists.

Additionally the runs could be filtered by their consequence for the selected time frame.

Results Charts
There are three different views to present the Test List Run Status:

Pass/Fail report per test count
Pass/Fail report in 100% stacked mode
Pass/Fail trend lines - available for single selected test list only
Additionally Data Labels could be shown or hidden.
The displayed chart could be zoomed in and out either with the magnifier on the right or from the percentage drop down, or scrolling the mouse wheel on the chart itself.
Results Overview
The Results Overview provides a pie chart which could be filtered to show all selected tests or all test lists pass/fail rate.

Results Details
The Results Details view provides pass/fail details for the selected test lists and the included tests. Test could be filtered per pass/fail/not run status.

Single Test List Pie Chart
From the Results tab could be generated single test list results displayed in easy-to-read pie charts.
Select a test list result from the Calendar view and double click it to drill down to the included tests.
Switch between Calendar and Report views to access the respective test list pie chart and the comment field.
