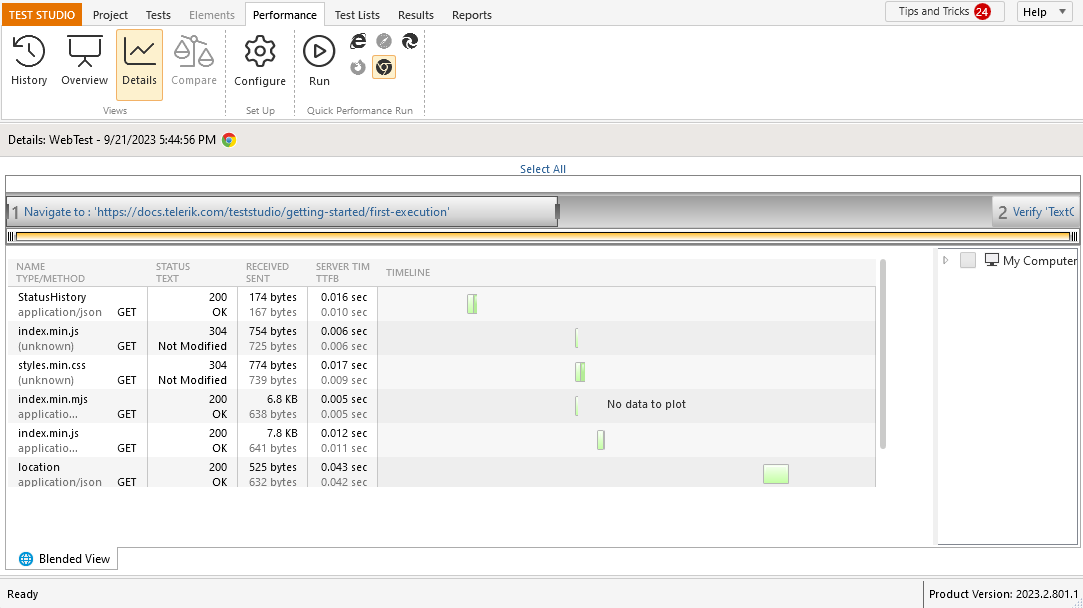
Details View
Click the Details button in the Views ribbon. See the requests made from the server, how long the requests take, and the bandwidth used. Check the Performance Counters on the right to see them in an overlaid line graph.

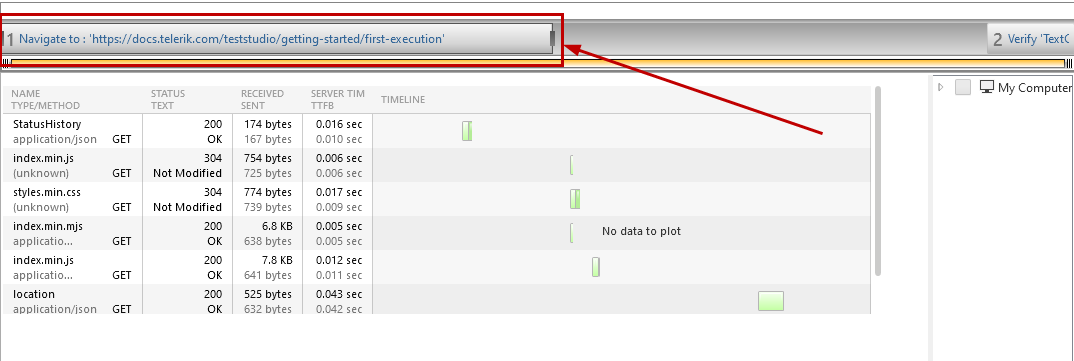
Each step of the Performance Run is represented as a block in the top horizontal bar. By default the entire run is selected. Click a specific step block to conform the selection area to it.

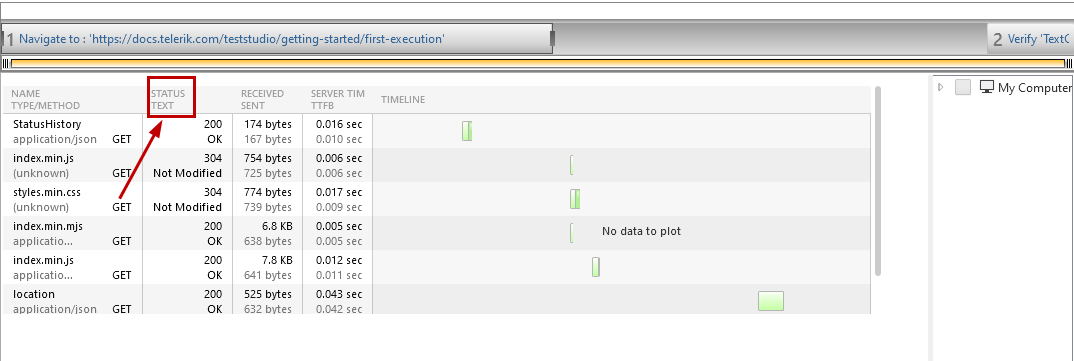
Each HTTP Traffic Request of the Performance Run is listed as a row in the grid below. Click a column header to sort by that column.
