Wrapping Text in Data Labels of a Graph Report Item
Environment
| Version | Product | Author |
|---|---|---|
| 18.1.24.514+ | Standalone Report Designer | Desislava Yordanova |
Description
When using the Graph Report Item with the Column chart type, sometimes the text in data labels is too long, and it exceeds the column's width. This KB article demonstrates how to wrap text in data labels for a Graph Report Item or how to format long text in data labels to fit within a column in a graph report.
Solution
To wrap text in data labels for a Column chart in the Graph Report Item, use the built-in text functions to insert a new line character in the DataPointLabels text.
- Select the
BarSeries. -
Set the
DataPointLabelwith the appropriateReplacefunction to insert a new line character where needed. For example:= Replace(Fields.CategoryNamePlusPercent, ' ', ' ')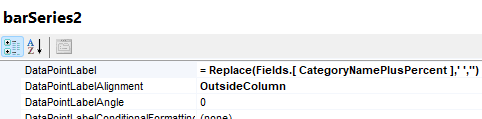
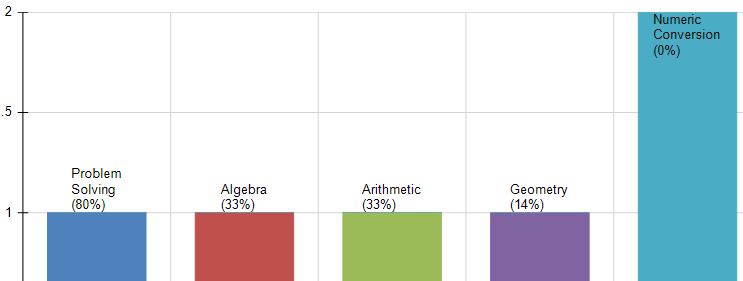
This function replaces spaces with a new line character, effectively wrapping the text.
Additionally, consider extending expressions for more complex formatting needs. For more details, refer to the Extending Expressions section in the documentation.
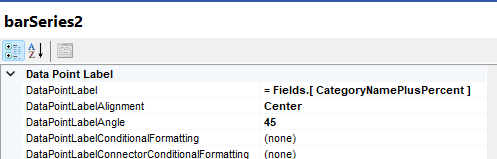
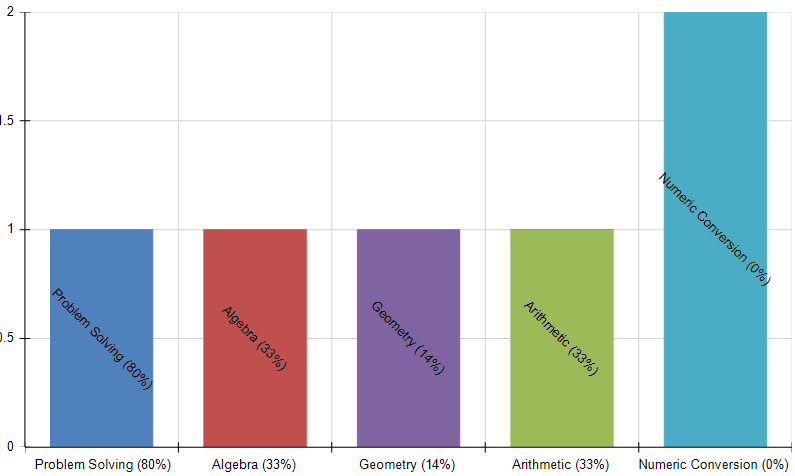
An alternative approach is to rotate the labels and center the text to fit the data labels within the column's width.
Suggested Workarounds
-
Rotate the labels: Apply rotation to the labels to make more space for the text. This can be done from the properties of the
Graph Report Item. - Custom functions: For more advanced scenarios, create custom functions to format the data labels' text.
Experiment with text wrapping and rotation to find the best presentation for your specific case. Adjustments might be needed based on the actual data and chart size.