Removing Bar Border in Bar and Column Graphs
Environment
| Product | Reporting |
Description
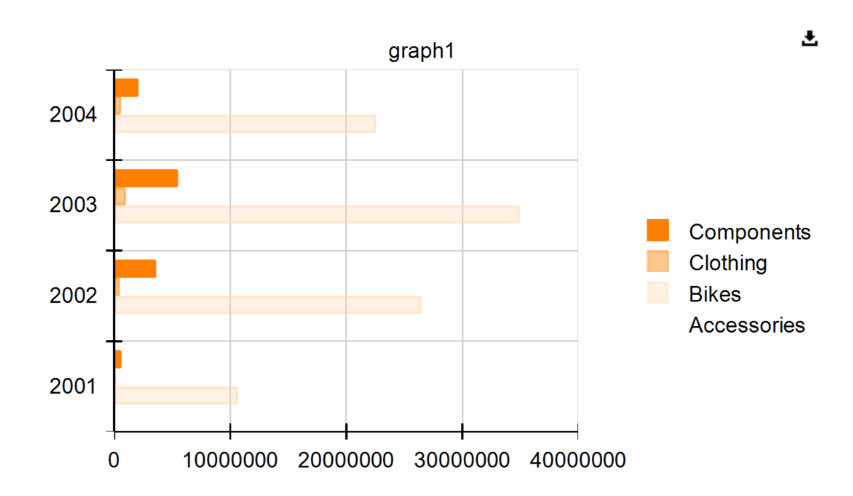
I want to remove the darker, solid border around bars in a graph with a bar series. The border is more visible in the HTML5 Report Viewer and overlaps the grid lines. The bars use a semi-transparent yellow color palette, which allows grid lines to show through. The goal is to eliminate the darker border while maintaining the semi-transparent fill effect.
Solution
To remove the darker border around the bars:
- Select the graph in the Report Designer tool of choice.
- Expand the Series property.
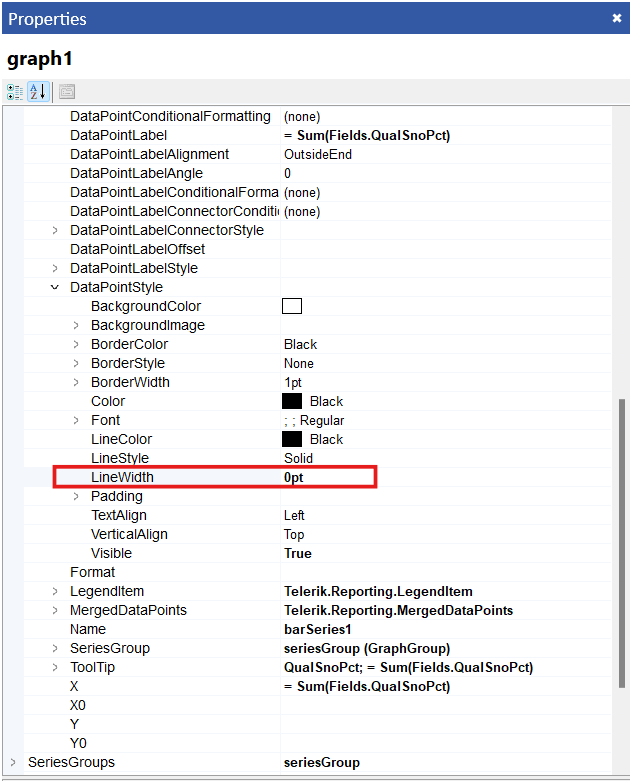
- Locate and expand the DataPointStyle property of the GraphSeries.
- Set the LineWidth property to 0pt.
This removes the darker border around the bars, ensuring they appear without overlapping grid lines.