Grouping Data Within a Single Report DataSource
Environment
| Product | Progress® Telerik® Reporting |
Description
Creating a report with grouped data according to a specific column, including conditional formatting and total calculations, is required. This knowledge-base article also answers the following questions:
- How to use a single DataSource to group data in a Telerik Report?
- How to add a Crosstab with row grouping by a specific criterion in a Telerik Report?
- How to apply conditional formatting for alternating rows in a Telerik Report?
Solution
To achieve a report with data grouped by a specific column, including conditional formatting for alternating groups and total calculations, follow these steps:
- Add a List item to the Detail section of the report and set its DataSource to the DataSource containing the fields to group by.
-
Add a new parent row group to the List, setting the expression of the group to the field(s) you wish to group by. Ensure the "Add Header" option is checked.
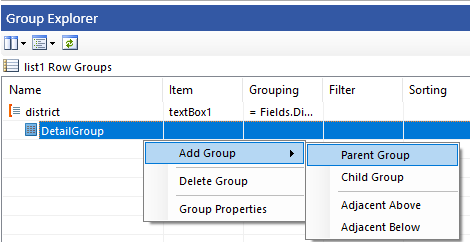
In the List header section, make it visible through the "Style.Visible" property. This section will display the grouped content.
- Insert a Panel item in the header section of the List.
- Add a TextBox item to the Panel and set its value to the field(s) the List is grouped by.
-
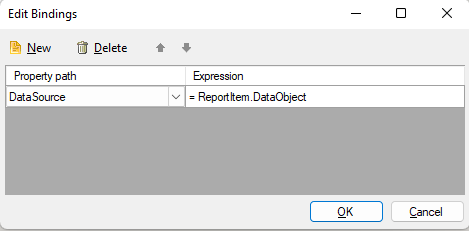
Add a Table item to the Panel (below the TextBox) and set its DataSource to the DataObject of the List through a Binding.
-
For conditional formatting, select the Panel item and apply a background colour alternation between groups using the expression
= RowNumber('name-of-the-list-item') % 2.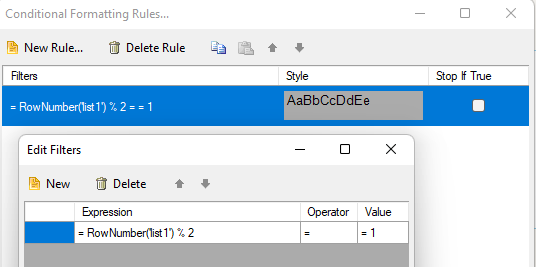
To add totals, use a Crosstab item with row grouping by the criterion (e.g., Gender) and add a Total outside the gender groups to display the Sum of both genders.
- Apply conditional formatting to the Crosstab for alternating district backgrounds using the same modulo operation as in step 7.
This approach eliminates the need for multiple DataSource calls and allows for efficient grouping, total calculations, and conditional formatting within a single report.