Creating and Filtering a Pie Chart
Environment
| Product | Progress® Telerik® Reporting |
|---|---|
| Version | 18.1.24.514 |
Description
Creating a pie chart that supports filtering with a multivalue report parameter that allows for dynamic data visualization based on user selection. This KB article also answers the following questions:
- How can I add multiple parameters to a Telerik Reporting report?
- How do I apply filtering based on these parameters?
- What steps are necessary to allow end-user selection for pie chart data?
Solution
To create and filter a pie chart with multiple parameters in Telerik Reporting, follow these steps:
- Create a Pie Chart: Refer to the Creating and Customizing Pie Charts documentation for detailed instructions on how to create a sample Pie chart.
- Add Report Parameters: These parameters will be connected to the graph filter for dynamic data visualization. For guidance on adding report parameters, refer to - Approaches for Adding Report Parameters.
-
Configure the Parameters with the Report Parameter Collection Editor: We will create a
MultiValuereport parameter that will be used to filter the data but all values will be selected initially. In the "Report Parameter Collection Editor", set theMultiValueoption toTrueand adjust theValue. Use theEdit Expressiondialog to select"Functions" -> "Aggregates" -> "AllDistinctValues". The expression for theValueproperty of the report parameter will look like= AllDistinctValue(Fields.StoreName). This configuration allows the parameter to accept multiple values for filtering and select all distinct options for theValueMember.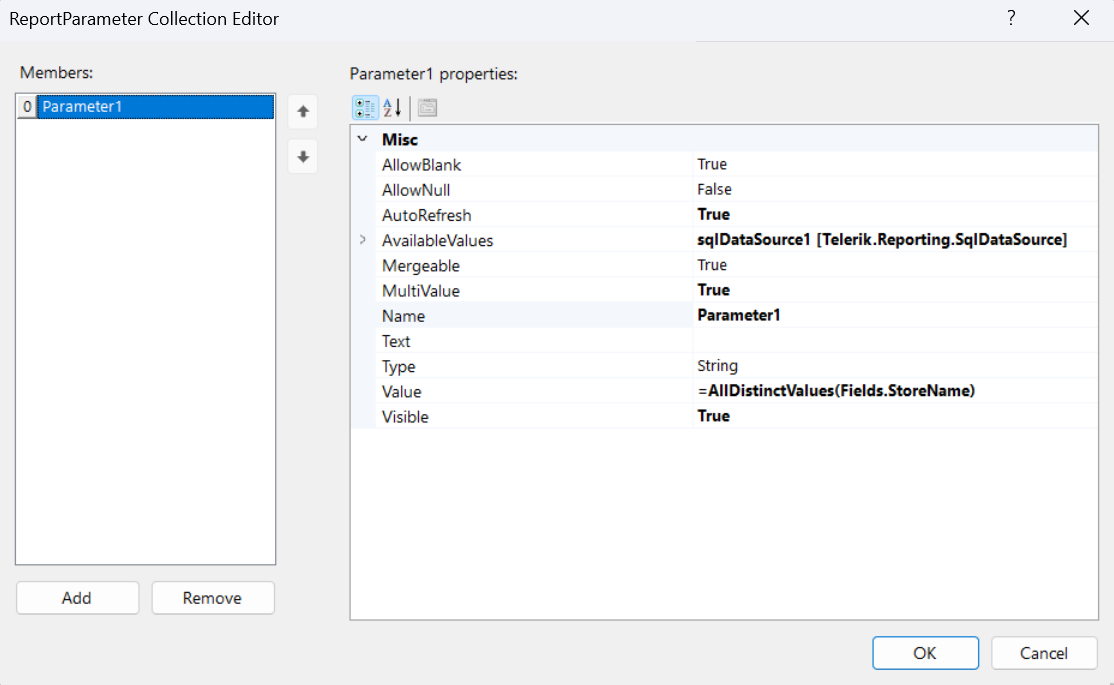
-
Connect the Parameter to the Pie Chart Filter: To enable filtering based on the parameter, access the pie chart's
Edit Filtersoption and set theOperatortoIn. This connects the report parameter to the chart, enabling end-user selection and filtering - Adding Filtering to Graph Item.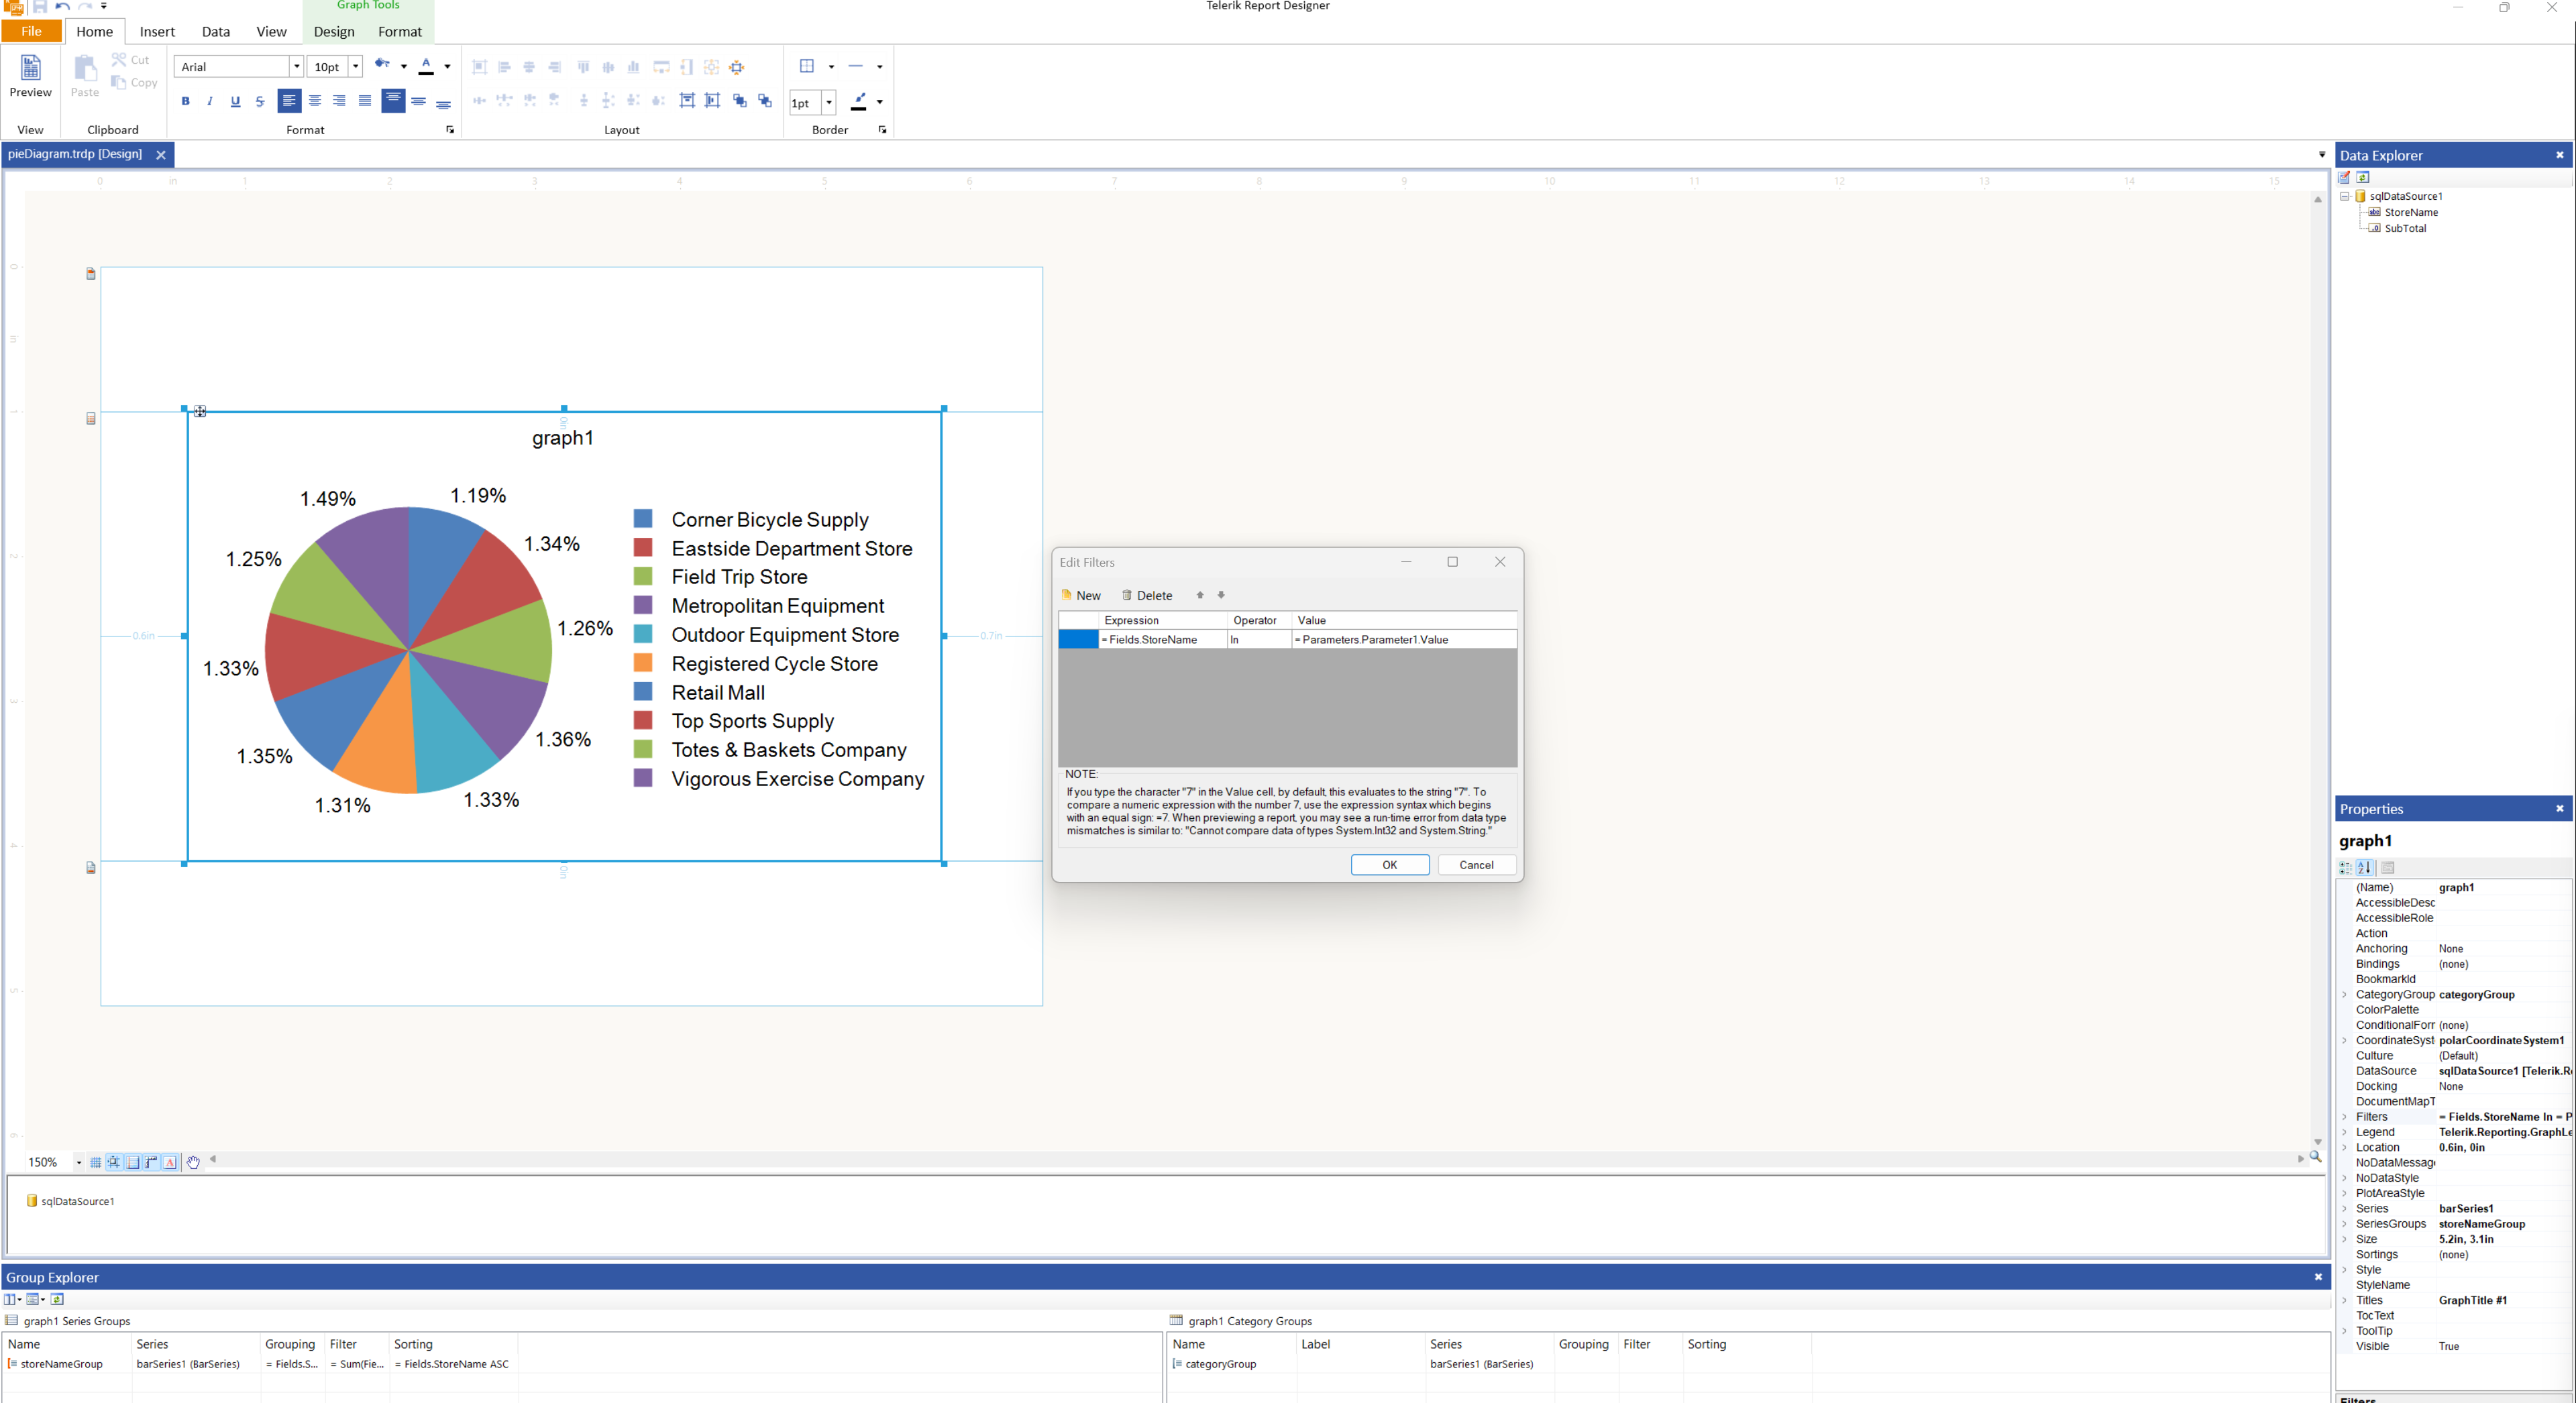
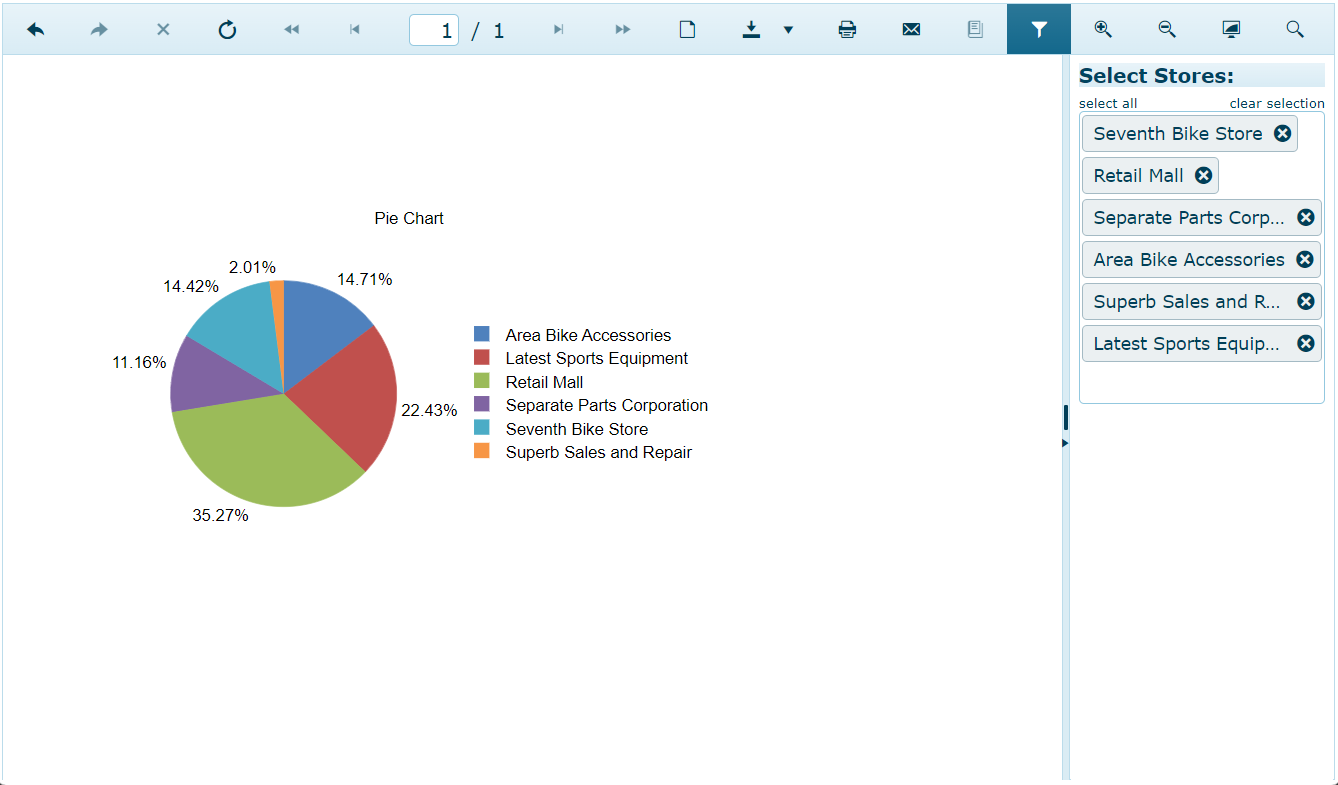
In the end, when previewed(for example in the HTML5 Report Viewer), the pie chart will look as follows: