Axis
This article will show you how to control the range of the plotted data and how to show and customize the axis indicator.
Showing the Axis
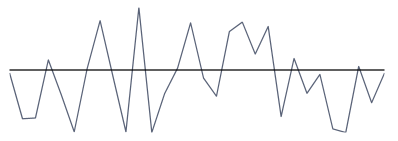
The axis indicator is a horizontal line drawn accross the sparkline control.
To show the axis set the ShowAxis property of the sparkline control to True.
By default the axis will be shown on value 0. This means that if the axis' range doesn't contain the 0 value, the axis won't be displayed. In this case you can set the AxisOriginValue property of the sparkline control manually.
Example 1: Setting ShowAxis
<telerik:RadLinearSparkline ShowAxis="True" />
Figure 1: Sparkline Axis

Customizing the Axis
The sparkline provides couple of properties that can be used to customize the axis.
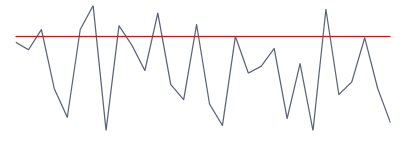
To set the stroke of the axis, set the AxisStroke property.
To set the origin value of the axis (in relation to the vertical axis), set the AxisOriginValue property. This controls the vertical position of the axis. The default origin is 0.
Example 2: Customizing the axis indicator
<telerik:RadLinearSparkline ShowAxis="True"
                            AxisStroke="Red"
                            AxisOriginValue="150"/>
Figure 1: Sparkline Customized Axis

Controlling the Data Range
By default the axes of the sparkline will auto calculate their ranges based on the plotted data. To manually adjust the range set the AutoRange property to False. Then you can use the MinXValue, MaxXValue and MinYValue, MaxYValue properties to set minimum and maximum values of the horizontal and the vertical axes.
Example 3: Setting manual range
<telerik:RadColumnSparkline AutoRange="False"
                            MinXValue="100"
                            MaxXValue="300"
                            MinYValue="10"
                            MaxYValue="80"/>
Bind Minimum and Maximum Values of the Axis
As mentioned in the above section, you can adjust the Data range by setting the MinXValue, MaxXValue, and MinYValue, MaxYValue properties. These properties are of type double. Now, if you want to bind these properties to custom properties of type DateTime, we can use the Ticks property, which the DateTime object provides. This property is of type long and represents a given date in numbers. Example 4 demonstrate how we can take advantage of this functionality and bind the MinXValue, MaxXValue and MinYValue, MaxYValue properties.
Example 4: Bind Minimum and Maximum Values of the Axis
<telerik:RadColumnSparkline AutoRange="False"
                            MinXValue="{Binding StartXDateTime.Ticks}"
                            MaxXValue="{Binding EndXDateTime.Ticks}"
                            MinYValue="{Binding StartYDateTime.Ticks}"
                            MaxYValue="{Binding StartYDateTime.Ticks}"/>