Chart Series Label Strategy
The chart's series label strategy is responsible for the visualization of the series labels. In a specific scenario, you may need to control their appearance. The chart allows you to do that by creating a class that derives from ChartSeriesLabelStrategy and override one or more of the following methods.
- CreateDefaultVisual(): This method returns a FrameworkElement which represents the visual element for the label. For example, this method can be used to create a StackPanel with two TextBlock. One will hold the value and the other one will have additional information about this value.
- GetLabelContent(): This method returns an object which represents the content of the label. You can override this one to modify what content to be displayed inside the label.
- GetLabelDesiredSize(): This method returns an object of type RadSize which represent the size of the label. Overriding this method, you can specify your own size for every label.
- GetLabelLayoutSlot(): This method returns an object of type RadRect. This RadRect represents the layout slot where the label is placed. The layout slot is the position and the size of the element.
- SetLabelContent(): This method can be overridden to add your own content to the label.
Those methods will be fired for each data point in the series, but there is a curious specific in the ChartSeriesLabelStrategy class and its methods. The methods won't be fired unless you specify that they should be used via the Options property. The property is a flags enum and it can accept several values. For example, you can specify that you want to use only the GetLabelContent and GetLayoutSlot methods and skip the others. To do so, you can use the following options:
Example 1: Setting LabelStrategyOptions
public override LabelStrategyOptions Options
{
    get
    {
        return LabelStrategyOptions.Content | LabelStrategyOptions.Arrange;
    }
}
Custom Series Label Strategy
In the following sections we will go through creating custom ChartSeriesLabelStrategy for the labels. First, we need to create a chart and populated with some points.
Example 2: Defining view models
public class DataItem
{
    public string Category { get; set; }
    public double Value { get; set; }
}

public class MainViewModel
{
    public ObservableCollection<ObservableCollection<DataItem>> SeriesData { get; set; }
    private Random r = new Random();
    public MainViewModel()
    {
        this.SeriesData = new ObservableCollection<ObservableCollection<DataItem>>()
        {
            GenerateData(10, 50),
            GenerateData(100, 300),
        };
    }

    private ObservableCollection<DataItem> GenerateData(int valueRangeStart, int valueRangeEnd)
    {
        var result = new ObservableCollection<DataItem>();
        var startDate = new DateTime(2018, 4, 10);
        for (int i = 0; i < 21; i++)
        {
            result.Add(new DataItem() { Category = "Category " + i, Value = r.Next(valueRangeStart, valueRangeEnd) });
        }
        return result;
    }
}
Example 3: Defining RadCartesianChart in XAML
<telerik:RadCartesianChart Palette="Office2016" >
    <telerik:RadCartesianChart.HorizontalAxis>
        <telerik:CategoricalAxis />
    </telerik:RadCartesianChart.HorizontalAxis>
    <telerik:RadCartesianChart.VerticalAxis>
        <telerik:LinearAxis />
    </telerik:RadCartesianChart.VerticalAxis>

    <telerik:RadCartesianChart.Series>
        <telerik:BarSeries CombineMode="Stack" ShowLabels="True"
                               ItemsSource="{Binding SeriesData[1]}"
                               ValueBinding="Value"
                               CategoryBinding="Category">
            <telerik:BarSeries.LabelDefinitions>
                <telerik:ChartSeriesLabelDefinition VerticalAlignment="Center"  />
            </telerik:BarSeries.LabelDefinitions>
        </telerik:BarSeries>
        <telerik:BarSeries CombineMode="Stack"  ShowLabels="True"
                               ItemsSource="{Binding SeriesData[0]}"
                               ValueBinding="Value"
                               CategoryBinding="Category">
            <telerik:BarSeries.LabelDefinitions>
                <telerik:ChartSeriesLabelDefinition VerticalAlignment="Center" />
            </telerik:BarSeries.LabelDefinitions>
        </telerik:BarSeries>
    </telerik:RadCartesianChart.Series>
</telerik:RadCartesianChart>
Example 4: Setting DataContext of the Window
public partial class MainWindow : Window
{
    public MainWindow()
    {
        InitializeComponent();
        this.DataContext = new MainViewModel();
    }
}
Figure 1: Labels without Custom Label Strategy
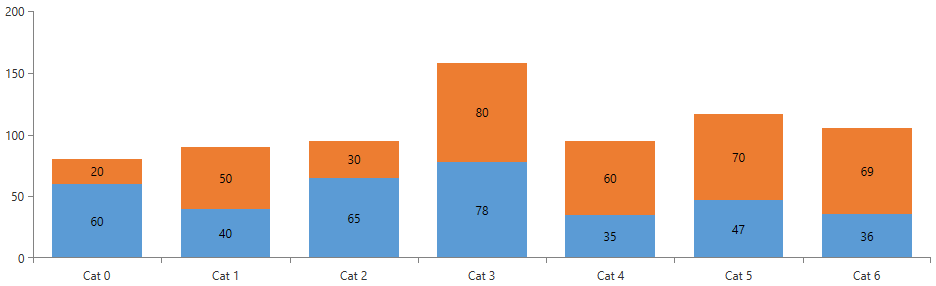
Looking at Figure 1 every bar has its label position in its center. Our task is to shows what percent every bar represent from the sum of every data point in one category. First, we need to create a custom class which inherits ChartSeriesLabelStrategy. In our case, we are going to override GetLabelContent() and create custom logic which calculates what percent every value represent.
Example 5: Creating custom ChartSeriesLabelStrategy
public class PercentageLabelStrategy : ChartSeriesLabelStrategy
{
    public override LabelStrategyOptions Options
    {
        get { return LabelStrategyOptions.Content; }
    }

    public override object GetLabelContent(DataPoint point, int labelIndex)
    {
        CategoricalDataPoint dataPoint = (CategoricalDataPoint)point;
        ChartSeries series = (ChartSeries)point.Presenter;
        RadCartesianChart chart = (RadCartesianChart)series.Chart;

        double sum = 0;
        foreach (BarSeries barSeries in chart.Series)
        {
            foreach (CategoricalDataPoint dp in barSeries.DataPoints)
            {
                if (object.Equals(dp.Category, dataPoint.Category))
                {
                    sum += dp.Value.Value;
                    break;
                }
            }
        }

        string finalContent = point.Label.ToString();
        var categoricalPoint = point as CategoricalDataPoint;
        if (categoricalPoint != null)
        {
            var percentageResult = (categoricalPoint.Value / sum);
            finalContent = string.Format("{0:P0}", percentageResult);
        }
        return finalContent;
    }
}
Example 6: Setting custom ChartSeriesLabelStrategy
<telerik:RadCartesianChart Palette="Office2016" Margin="10" >

    <telerik:RadCartesianChart.Resources>
        <local:PercentageLabelStrategy x:Key="PercentageLabelStrategy"/>
    </telerik:RadCartesianChart.Resources>

    <telerik:RadCartesianChart.HorizontalAxis>
        <telerik:CategoricalAxis />
    </telerik:RadCartesianChart.HorizontalAxis>
    <telerik:RadCartesianChart.VerticalAxis>
        <telerik:LinearAxis />
    </telerik:RadCartesianChart.VerticalAxis>

    <telerik:RadCartesianChart.Series>
        <telerik:BarSeries CombineMode="Stack" ShowLabels="True"
                               ItemsSource="{Binding SeriesData[1]}"
                               ValueBinding="Value"
                               CategoryBinding="Category">
            <telerik:BarSeries.LabelDefinitions>
                <telerik:ChartSeriesLabelDefinition VerticalAlignment="Center" Strategy="{StaticResource PercentageLabelStrategy}" />
            </telerik:BarSeries.LabelDefinitions>
        </telerik:BarSeries>
        <telerik:BarSeries CombineMode="Stack"  ShowLabels="True"
                               ItemsSource="{Binding SeriesData[0]}"
                               ValueBinding="Value"
                               CategoryBinding="Category">
            <telerik:BarSeries.LabelDefinitions>
                <telerik:ChartSeriesLabelDefinition VerticalAlignment="Center" Strategy="{StaticResource PercentageLabelStrategy}" />
            </telerik:BarSeries.LabelDefinitions>
        </telerik:BarSeries>
    </telerik:RadCartesianChart.Series>
</telerik:RadCartesianChart>
Figure 2: Labels with Custom Label Strategy
