Control the Series Items overlapping via ZIndex property
The following article demonstrates how to control the overlapping of Bubbles when they are positioned too close. By selecting one of the Bubbles the Canvas.ZIndex attached property will increase it's value (by default it is 0) which will cause the selected Bubble to be positioned over the others.
1. Create a class of Business Objects that will be used to populate the Chart:
public class UserDataPoint
    {
        private double _y;
        private double _bubbleSize;
        private string _legendLabel;

        public UserDataPoint()
        {
        }

        public UserDataPoint(double x, double y)
        {
            this._y = y;
        }

        public double Y
        {
            get
            {
                return _y;
            }
            set
            {
                this._y = value;
            }
        }

        public double BubbleSize
        {
            get
            {
                return _bubbleSize;
            }
            set
            {
                this._bubbleSize = value;
            }
        }

        public string LegendLabel
        {
            get
            {
                return _legendLabel;
            }
            set
            {
                this._legendLabel = value;
            }
        }
    }

    public static class SeriesExtensions
    {

        public static List<UserDataPoint> GetUserBubbleData()
        {
            List<UserDataPoint> points = new List<UserDataPoint>();

            points.Add(CreateBubbleUserDataPoint(20, -100));
            points.Add(CreateBubbleUserDataPoint(40, 100));
            points.Add(CreateBubbleUserDataPoint(80, -20));
            points.Add(CreateBubbleUserDataPoint(60, 10));

            return points;
        }

        private static UserDataPoint CreateBubbleUserDataPoint(double valueY, double bubbleSize)
        {
            UserDataPoint dataPnt = new UserDataPoint();
            dataPnt.Y = valueY;
            dataPnt.BubbleSize = bubbleSize;
            return dataPnt;
        }

      }
Public Class UserDataPoint
            Private _y As Double
            Private _bubbleSize As Double
            Private _legendLabel As String

            Public Sub New()
            End Sub

            Public Sub New(ByVal x As Double, ByVal y As Double)
                  Me._y = y
            End Sub

            Public Property Y() As Double
                  Get
                        Return _y
                  End Get
                  Set(ByVal value As Double)
                        Me._y = value
                  End Set
            End Property

            Public Property BubbleSize() As Double
                  Get
                        Return _bubbleSize
                  End Get
                  Set(ByVal value As Double)
                        Me._bubbleSize = value
                  End Set
            End Property

            Public Property LegendLabel() As String
                  Get
                        Return _legendLabel
                  End Get
                  Set(ByVal value As String)
                        Me._legendLabel = value
                  End Set
            End Property
End Class

      Public NotInheritable Class SeriesExtensions

            Private Sub New()
            End Sub
            Public Shared Function GetUserBubbleData() As List(Of UserDataPoint)
                  Dim points As New List(Of UserDataPoint)()

                  points.Add(CreateBubbleUserDataPoint(20, -100))
                  points.Add(CreateBubbleUserDataPoint(40, 100))
                  points.Add(CreateBubbleUserDataPoint(80, -20))
                  points.Add(CreateBubbleUserDataPoint(60, 10))

                  Return points
            End Function

            Private Shared Function CreateBubbleUserDataPoint(ByVal valueY As Double, ByVal bubbleSize As Double) As UserDataPoint
                  Dim dataPnt As New UserDataPoint()
                  dataPnt.Y = valueY
                  dataPnt.BubbleSize = bubbleSize
                  Return dataPnt
            End Function

      End Class
2. Create a BubbleViewModel class:
public class BubbleViewModel
    {
        private List<UserDataPoint> _bubbleData;

        public List<UserDataPoint> BubbleData
        {
            get
            {
                if (this._bubbleData == null)
                {
                    this._bubbleData = SeriesExtensions.GetUserBubbleData();
                }

                return this._bubbleData;
            }
        }
    }
Public Class BubbleViewModel
Private _bubbleData As List(Of UserDataPoint)
Public ReadOnly Property BubbleData() As List(Of UserDataPoint)
Get
If Me._bubbleData Is Nothing Then
Me._bubbleData = SeriesExtensions.GetUserBubbleData()
End If
Return Me._bubbleData
End Get
End Property
End Class
3. Add a new RadChart declaration and new SeriesMapping (the Chart is populated via Manual Series Mapping).
<TelerikChart:RadChart x:Name="RadChart1" ItemsSource="{Binding BubbleData}">
            <TelerikChart:RadChart.SeriesMappings>
                <TelerikCharting:SeriesMapping LegendLabel="Bubble Series 0">
                    <TelerikCharting:SeriesMapping.SeriesDefinition>
                        <TelerikCharting:BubbleSeriesDefinition  ItemStyle="{StaticResource CustomBubble}" BubbleSizeRelative="False">
                            <TelerikCharting:BubbleSeriesDefinition.InteractivitySettings>
                                <TelerikCharting:InteractivitySettings HoverScope="Item" SelectionMode="Single" SelectionScope="Item" />
                            </TelerikCharting:BubbleSeriesDefinition.InteractivitySettings>
                        </TelerikCharting:BubbleSeriesDefinition>
                    </TelerikCharting:SeriesMapping.SeriesDefinition>
                    <TelerikCharting:SeriesMapping.ItemMappings>
                        <TelerikCharting:ItemMapping FieldName="Y" DataPointMember="YValue" />
                        <TelerikCharting:ItemMapping FieldName="BubbleSize" DataPointMember="BubbleSize" />
                    </TelerikCharting:SeriesMapping.ItemMappings>
                </TelerikCharting:SeriesMapping>
            </TelerikChart:RadChart.SeriesMappings>
        </TelerikChart:RadChart>
Selection of Bubble Items is achieved via Interactivity Effects feature of the RadChart.
4. In the MainPage.xaml.cs subscribe to SelectionChanged event of the ChartArea and make sure there is only one Bubble Item Selected. Set the Canvas.ZIndex property of the selected Bubble to 2000 and make it 0 for all others:
public MainPage()
        {
            InitializeComponent();

            this.RadChart1.DefaultView.ChartArea.SelectionChanged += new EventHandler<ChartSelectionChangedEventArgs>(ChartArea_SelectionChanged);
        }

        void ChartArea_SelectionChanged(object sender, ChartSelectionChangedEventArgs e)
        {
            if (e.AddedItems.Count == 1)
                SelectItem(e.AddedItems[0]);
        }

        private void SelectItem(DataPoint point)
        {
            var bubbles = this.RadChart1.DefaultView.ChartArea.ChildrenOfType<Bubble>();

            foreach (Bubble item in bubbles)
                item.ClearValue(Canvas.ZIndexProperty);

            Bubble selectedBubble = bubbles.SingleOrDefault(bubble => bubble.DataContext == point);

            if (selectedBubble != null)
                Canvas.SetZIndex(selectedBubble, 2000);
        }
}
Public Sub New()
InitializeComponent()
AddHandler RadChart1.DefaultView.ChartArea.SelectionChanged, AddressOf ChartArea_SelectionChanged
End Sub
Private Sub ChartArea_SelectionChanged(ByVal sender As Object, ByVal e As ChartSelectionChangedEventArgs)
If e.AddedItems.Count = 1 Then
SelectItem(e.AddedItems(0))
End If
End Sub
Private Sub SelectItem(ByVal point As DataPoint)
Dim bubbles = Me.RadChart1.DefaultView.ChartArea.ChildrenOfType(Of Bubble)()
For Each item As Bubble In bubbles
item.ClearValue(Canvas.ZIndexProperty)
Next item
Dim selectedBubble As Bubble = bubbles.SingleOrDefault(Function(bubble) bubble.DataContext Is point)
If selectedBubble IsNot Nothing Then
Canvas.SetZIndex(selectedBubble, 2000)
End If
End Sub
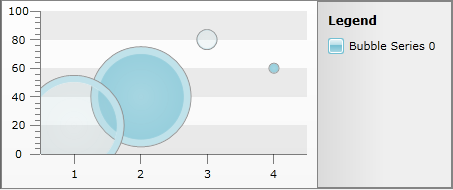
5. The result: