Understanding Wizard Values Data Table Tab
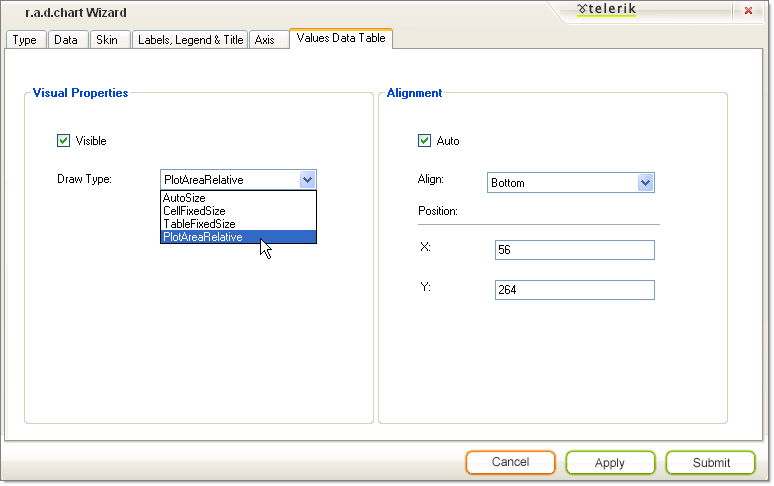
The Values Data Table tab of the Wizard controls the general look and positioning of the chart data table.
Visual Properties
Check Visible to display the chart data table. By default this is unchecked.
Select Draw Type from the drop down list to control the general size and positioning of the chart. Select AutoSize to have each cell size to the data inside of it. PlotAreaRelative places each cell just below the chart series item it represents. CellFixedSize and TableFixedSize fix the size of the cells or table irrespective of the data it contains.
Alignment
Use the Align drop down list to place the chart data table in a predefined position (e.g. Top, Bottom, BottomRight, etc.) To place the data table at exact coordinates, uncheck Auto and enter values for X and Y.
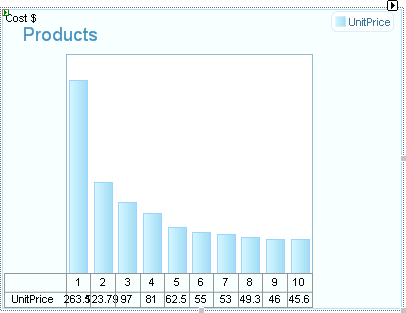
As a result you will get the following chart: