Features
RadPivotGrid is a very powerful tool for aggregations and calculations.
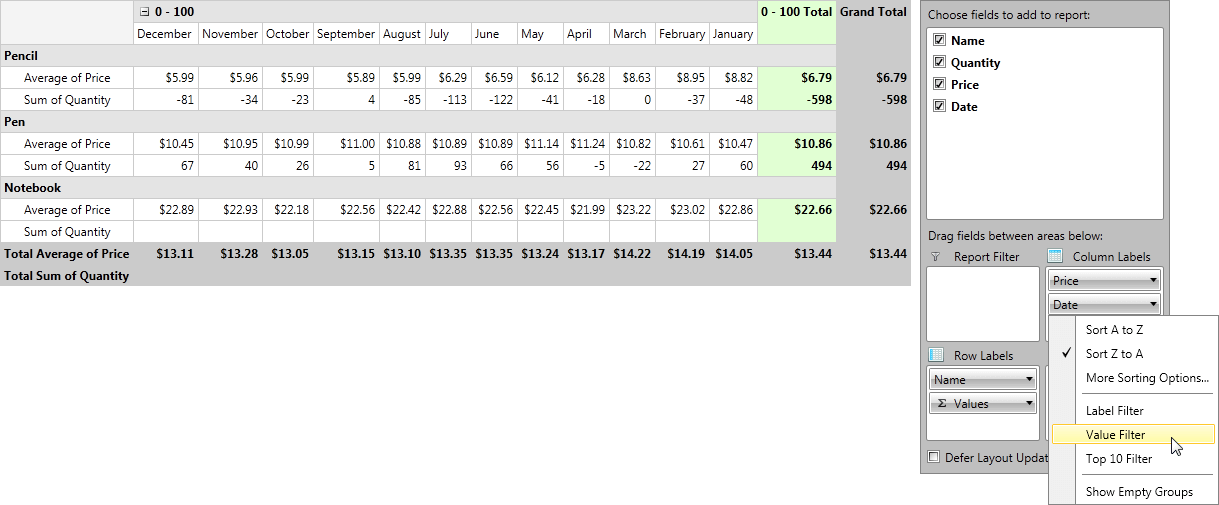
Using Filters for the data - you can apply different filters to change the data that will show in RadPivotGrid. By using them even the biggest report can be reduced to easy to use and compact view. There are three filters that you can use: Value Filter, Label Filter and Top 10 Filter on all Rows and Columns. The Label Filter is applied on the Header by using string comparison, the Value Filter and Top 10 filters are applied by using number comparison between the GrandTotals of the groups and the value we pass as parameter of the filter.
Sorting the data - you can use sorting based on the header (ascending or descending) or based on the GrandTotal of the aggregates.
Applying different number formats of the Aggregates - you can use predefined formats like "#.##" (represent the value as a double with two numbers after the decimal sign), "C"(the values will be presented as currency by using the current Culture) or define your own.
Applying different aggregate functions - Sum, Min, Max, etc. to change the Totals and get a totally different view of your Data.
Applying different Calculations on the aggregates - you can use % of Grand Total, % of Row Total, Difference From, etc. to view how each group is "participating" in the Total aggregation.
By combining these features you'll be able to modify RadPivotGrid and generate many different reports without modifying your data. All of them can be defined in the XAML, code behind or even at runtime by using RadPivotGrid.